Industry Services
Bedryfsdienste
24
25
Insetnavorsing (vervolg)
Input research (continued)
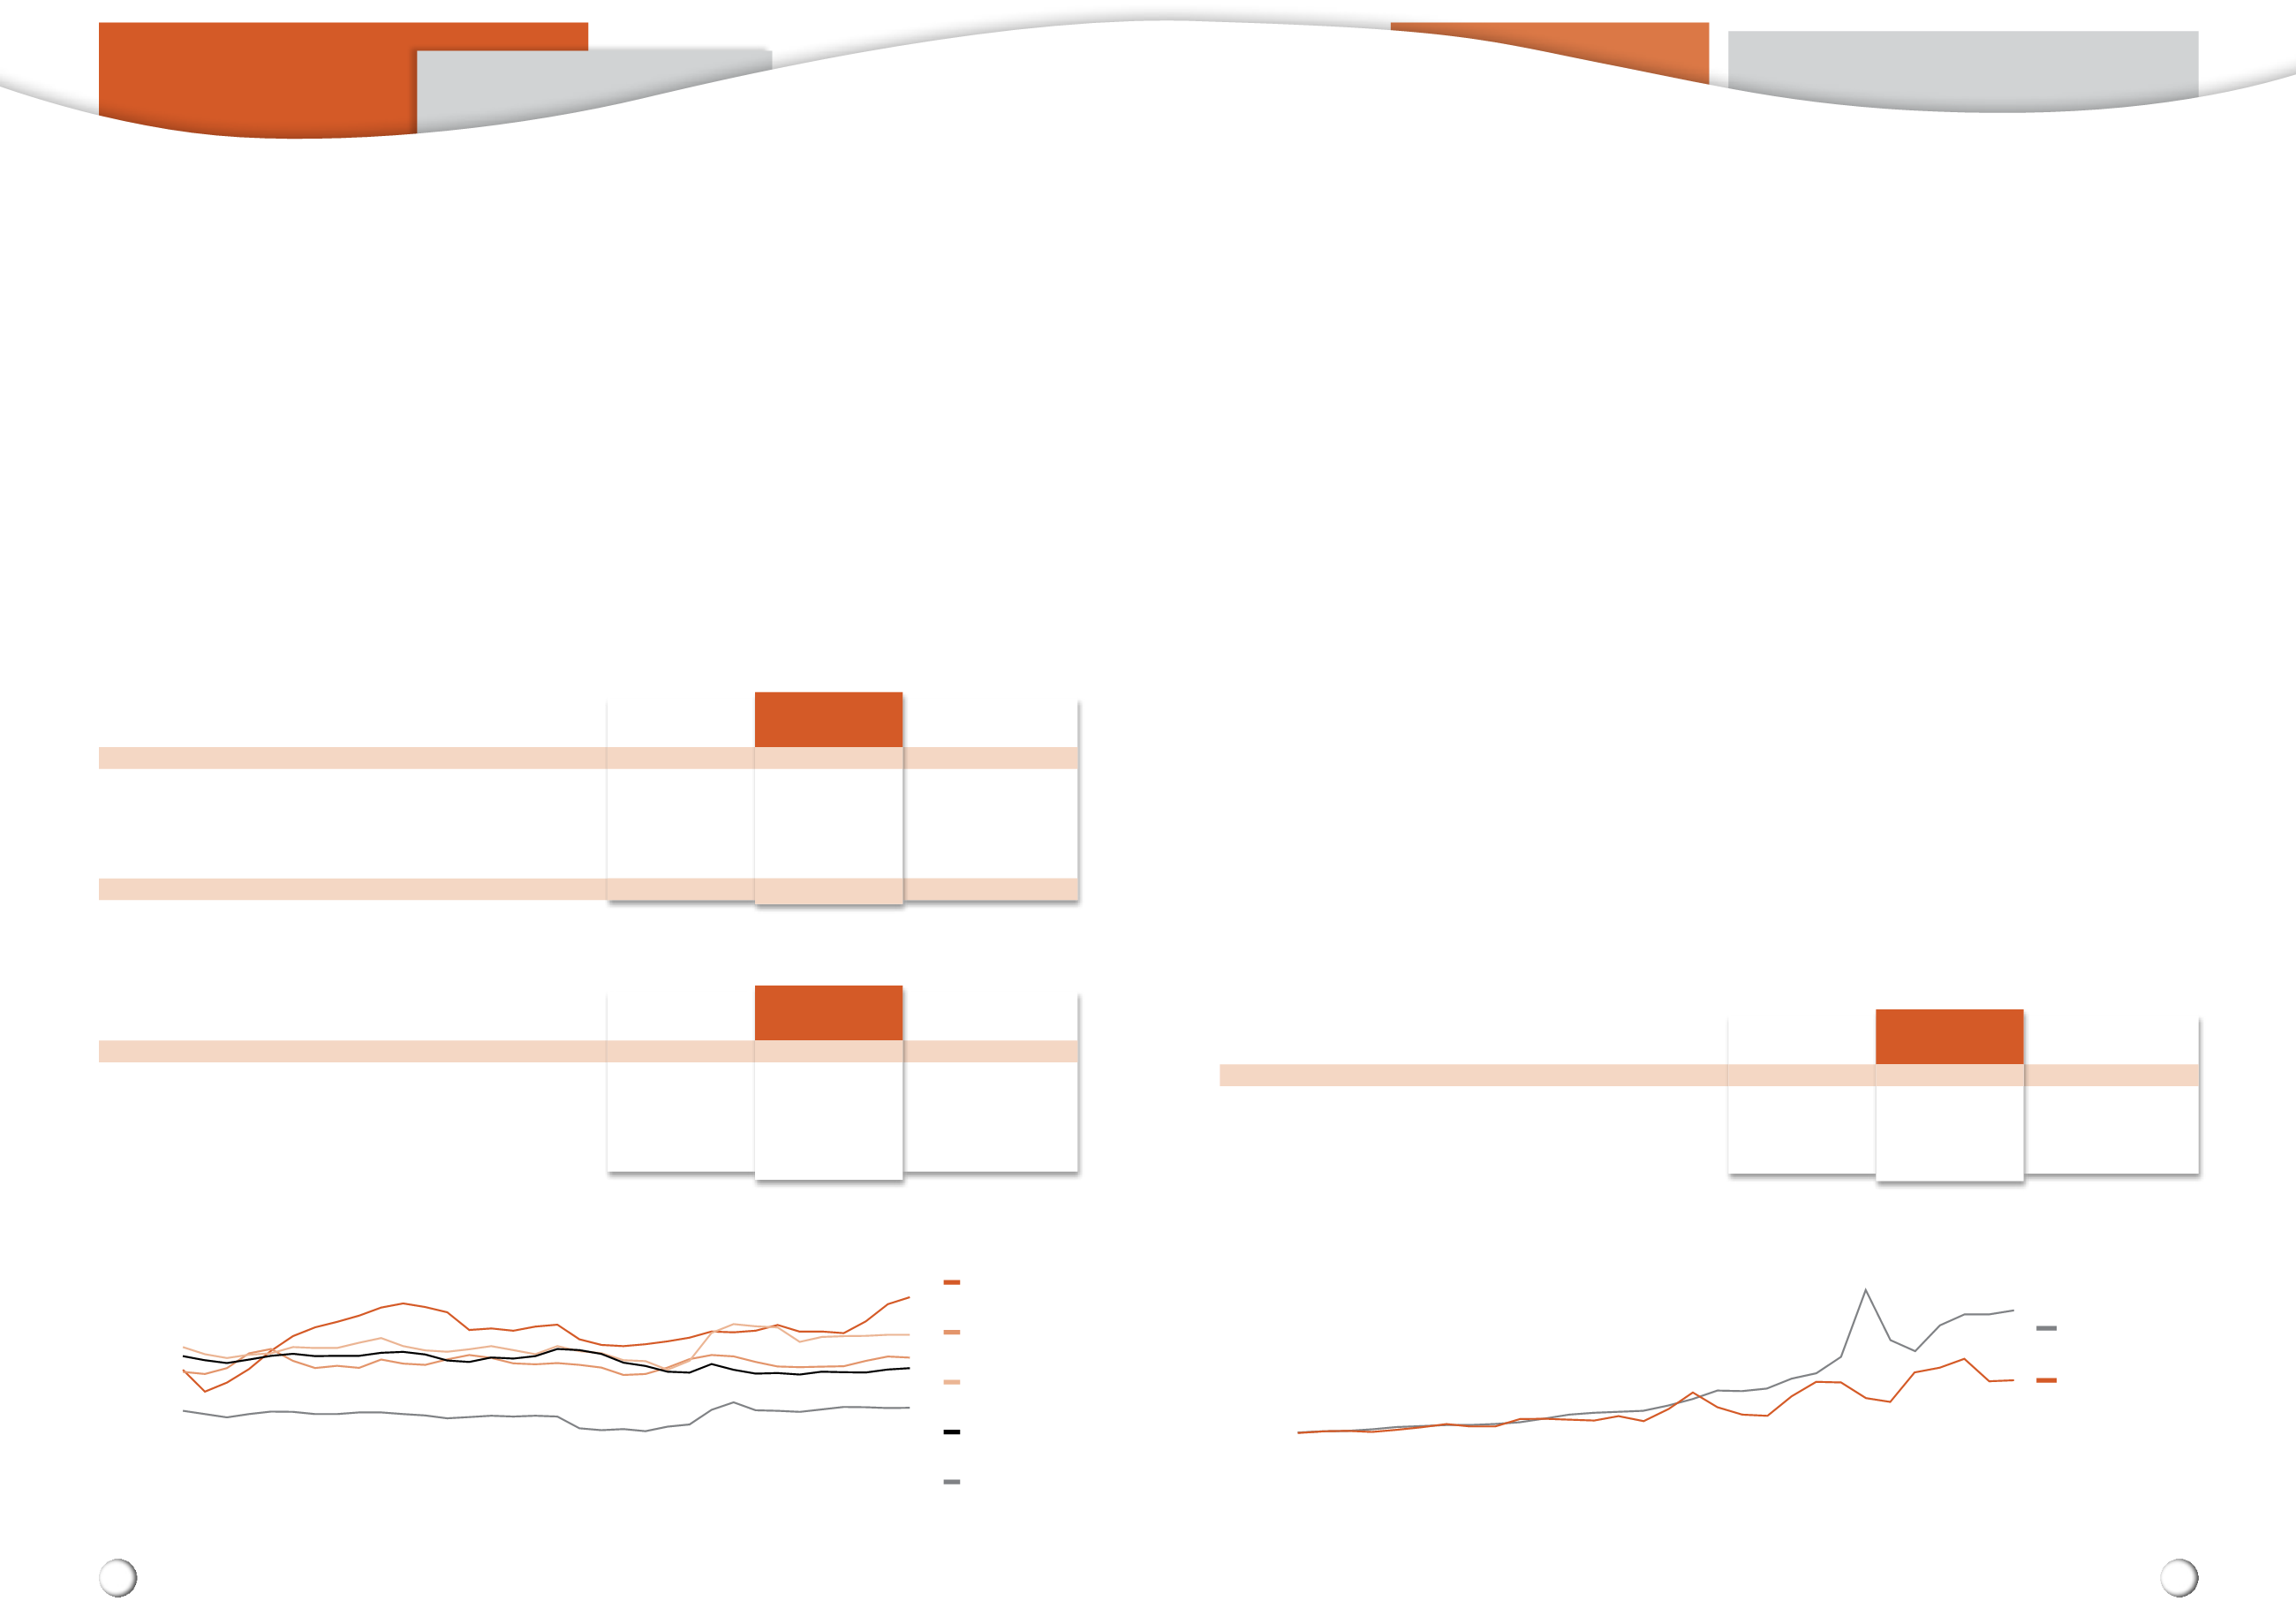
Graph 3: Indices of the producer price of maize and the prices of fertiliser
(Indices: 1985/1986 = 100)
Grafiek 3: Indekse van die produsenteprys van mielies en die prys van kunsmis
(Indekse: 1985/1986 = 100)
2 000
1 800
1 600
1 400
1 200
1 000
800
600
400
200
0
Index/
Indeks
1985/1986
1986/1987
1987/1988
1988/1989
1989/1990
1990/1991
1991/1992
1992/1993
1993/1994
1994/1995
1995/1996
1996/1997
1997/1998
1998/1999
1999/2000
2000/2001
2001/2002
2002/2003
2003/2004
2004/2005
2005/2006
2006/2007
2007/2008
2008/2009
2009/2010
2010/2011
2011/2012
2012/2013
2013/2014*
2014/2015*
Source/
Bron
: Grain SA/
Graan SA
* Preliminary/
Voorlopig
Fertiliser price index
Kunsmisprysindeks
Maize price index
Mielieprysindeks
Input research and development
Insetnavorsing en -ontwikkeling
Suid-Afrika voer al sy kaliumbenodighede sowel as ongeveer
70% van sy stikstofbenodighede in. Vanaf Oktober 2013
tot Oktober 2014 het die prys van KAN, ureum, MAP en
kaliumchloried gestyg (
Tabel 3
).
Wat die ruilvoet tussen die kunsmisprys en die mielieprys be-
tref, kan ‘n vergelyking tussen die produsenteprysindeks van
mielies en die kunsmisprysindeks getref word (
Grafiek 3
). Teen
‘n geraamde gemiddelde produsenteprys van R1 697 per ton vir
die komende produksieseisoen (2014/2015), verswak die ruilvoet
weens die styging in die jaarlikse gemiddelde kunsmisprys, terwyl
die mielieprys sywaarts beweeg het. Die gaping tussen die
mielie- en kunsmisprysindeks groei steeds.
KUNSMISMARK
Volgens Graan SA se produksiekostesyfers is R6,098 miljard se
kunsmis in mielieproduksie gebruik in die 2013/2014-produksie-
seisoen. Dit is ‘n verlaging van R91 miljoen sedert die vorige jaar
weens die afname in die oppervlakte wat aangeplant is.
PLAASLIKE BESKIKBAARHEID VAN KUNSMIS
Volgens die Kunsmisvereniging van Suidelike Afrika (FERTASA) sal
daar genoeg kunsmis beskikbaar wees vir die 2014/2015-produk-
sieseisoen en tydige aflewering sal nie ‘n probleem wees nie.
Landbouchemikalieëbedryf
Goeie vordering is met die registrasie van landbouchemikalieë
gemaak. In samesprekinge met die registrateur se kantoor is
onder meer die gehalte en registrasie van landbouchemikalieë
op die tafel geplaas.
PRYSE
Die aktiewe bestanddele van plaaslik-geformuleerde land-
bouchemikalieë word ingevoer, dus het die wisselkoers ‘n direkte
invloed op plaaslike pryse. Die internasionale prys (in dollarterme)
van glifosaat, atrasien en metolachloor het vanaf September
South Africa imports all its potassium requirements as well as
approximately 70% of its nitrogen requirements. From October
2013 to October 2014 the price of LAN, urea, MAP and
potassium chloride increased (
Table 3
).
With respect to the terms of trade between the fertiliser price
and the maize price, the producer price index for maize and the
fertiliser price index were compared (
Graph 3
). At an estimated
average producer price of R1 697 per ton for the coming produc-
tion season (2014/2015) the terms of trade are weakening due to
the increase in the annual average fertiliser price, while the maize
price moved sideways. The gap between the maize and fertiliser
price index continues to grow.
FERTILISER MARKET
According to the production cost figures of Grain SA fertiliser to
the value of R6,098 billion was used in maize production during
the 2013/2014 production season. This is a decrease of R91 million
since the previous year due to the smaller area planted.
LOCAL AVAILABILITY OF FERTILISER
According to the Fertiliser Associationof SouthernAfrica (FERTASA),
there will be enough fertiliser available for the 2014/2015
production season and timeous delivery will not be a problem.
Agrochemical industry
Good progress has been made with the registration of
agrochemicals. During discussions with the office of the registrar
the quality and registration of agrochemicals, among other
things, were placed on the table.
PRICES
The active ingredients of locally formulated agricultural chemicals
need to be imported, therefore the exchange rate has a direct
impact on local prices. The international price (dollar terms) of
Fertiliser
Kunsmis
Oct 2013
Okt 2013
Oct 2014
Okt 2014
% change
% verandering
R/ton
R/ton
LAN (28)/
KAN (28)
4 862
5 377
+11
Urea (46)/
Ureum (46)
5 952
6 476
+9
MAP
7 661
8 762
+14
Potassium chloride/
Kaliumchloried
6 861
7 269
+6
Table 3: Prices of local fertilisers (R/ton).
Tabel 3: Internasionale kunsmispryse (R/ton).
produksieseisoen beskikbaar sal wees. Saad van sekere gewilde
groottes en variëteite kan moontlik beperk wees.
Die kunsmisbedryf
Suid-Afrika is 'n netto invoerder van kunsmis. Plaaslike pryse is dus
aan dieselfde vraag- en aanbod-drywers as die internasionale
bedryf onderhewig. Verskepingskoste en die rand/dollar-wis-
selkoers beïnvloed ook plaaslike pryse.
KUNSMISPRYSE
Vanaf Oktober 2013 tot Oktober 2014 het die internasionale
prys van ammoniak, ureum, DAP en swael gestyg, terwyl die
prys van MOP gedaal het (
Tabel 1
).
Die rand/dollar-wisselkoers het van Oktober 2013 tot Oktober
2014 verswak. As gevolg hiervan was die persentasie verhoging in
internasionale pryse in randterme groter as in dollarterme (
Tabel 2
en
Grafiek 2
).
2014/2015 production season. However, the seed of certain
popular sizes and varieties may be limited.
The fertiliser industry
South Africa is a net importer of fertilisers. Local prices are
therefore subject to the same supply and demand drivers as
the international industry. Local prices are also influenced by
shipping costs and the rand/dollar exchange rate.
FERTILISER PRICES
From October 2013 to October 2014 the international price of
ammonia, urea, DAP and sulphur increased respectively, while
the price of MOP decreased (
Table 1
).
The rand/dollar exchange rate weakened from October
2013 to October 2014. Due to this the percentage increase in
international prices in rand terms was more than that in dollar
terms (
Table 2
and
Graph 2
).
Fertiliser
Kunsmis
Oct 2013
Okt 2013
Oct 2014
Okt 2014
% change
% verandering
$/ton
$/ton
Ammonia/
Ammoniak
438
570
+30
Urea/
Ureum
311
341
+10
DAP
366
428
+17
MOP/potassium chloride/
MOP
343
301
-12
Sulphur/
Swael
66
149
+126
Rand/$
10,047
11,190
+11
Table 1: International fertiliser prices ($/ton).
Tabel 1: Internasionale kunsmispryse ($/ton).
Fertiliser
Kunsmis
Oct 2013
Okt 2013
Oct 2014
Okt 2014
% change
% verandering
R/ton
R/ton
Ammonia/
Ammoniak
4 399
6 378
+45
Urea/
Ureum
3 125
3 816
+22
DAP
3 675
4 784
+30
MOP/potassium chloride/
MOP
3 449
3 371
-2
Sulphur/
Swael
666
1 672
+151
Table 2: International fertiliser prices (R/ton).
Tabel 2: Internasionale kunsmispryse (R/ton).
7 000
6 000
5 000
4 000
3 000
2 000
1 000
0
R/ton
Graph 2: International fertiliser prices in rand terms
Grafiek 2: Internasionale kunsmispryse in randterme
2012
Jan
Feb
Mar/
Mrt
Apr
May/
Mei
Jun
Jul
Aug
Sept/
Sep
Oct/
Okt
Nov
Dec/
Des
2013
Jan
Feb
Mar/
Mrt
Apr
May/
Mei
Jun
Jul
Aug
Sept/
Sep
Oct/
Okt
Nov
Dec/
Des
2014
Jan
Feb
Mar/
Mrt
Apr
May/
Mei
Jun
Jul
Aug
Sept/
Sep
Oct/
Okt
Source/
Bron
: Grain SA/
Graan SA
Sulphur
Swael
MOP (Potash)
MOP (Kalium)
DAP
Urea
Ureum
Ammonia
Ammoniak


