Industry Services
Bedryfsdienste
20
21
LET WEL:
Die inligting in
Grafiek 7
is van toepassing op die
Noordwes-Vrystaat-produksiegebied. Dit is ook vir die ander
graan- en oliesadeproduksiestreke beskikbaar.
Volgens Graan SA se koste-ontledings lyk dit asof die
2014/2015-produksieseisoen weer ‘n uitdagende een in terme
van winsgewendheid is (
Grafiek 7
en
8
op bladsy 22). Die
opbrengsscenario’s is gegrond op aannames van produksie-
toestande in die Noordwes-Vrystaat.
Uit
Grafiek 7
is dit duidelik dat grondbone die hoogste bruto
marge vir die komende produksieseisoen toon, gevolg deur
sojabone. Die mieliescenario met die hoër opbrengspotensiaal
is die enigste waar ‘n positiewe marge vir mielies bereken word.
NOTE:
The information in
Graph 7
applies to the North-West
Free State production area. It is available for the other grain
and oilseed production regions as well.
According to Grain SA’s cost analyses it appears that the
2014/2015 production season is once again challenging in
terms of profitability (
Graphs 7
and
8
on page 22). The yield
scenarios are based on assumptions of production conditions
in the North-West Free State.
From
Graph 7
it is clear that groundnuts have the highest
gross margin for the coming production season, followed by
soybeans. The maize scenario with the higher yield potential is
the only one where a positive margin is calculated.
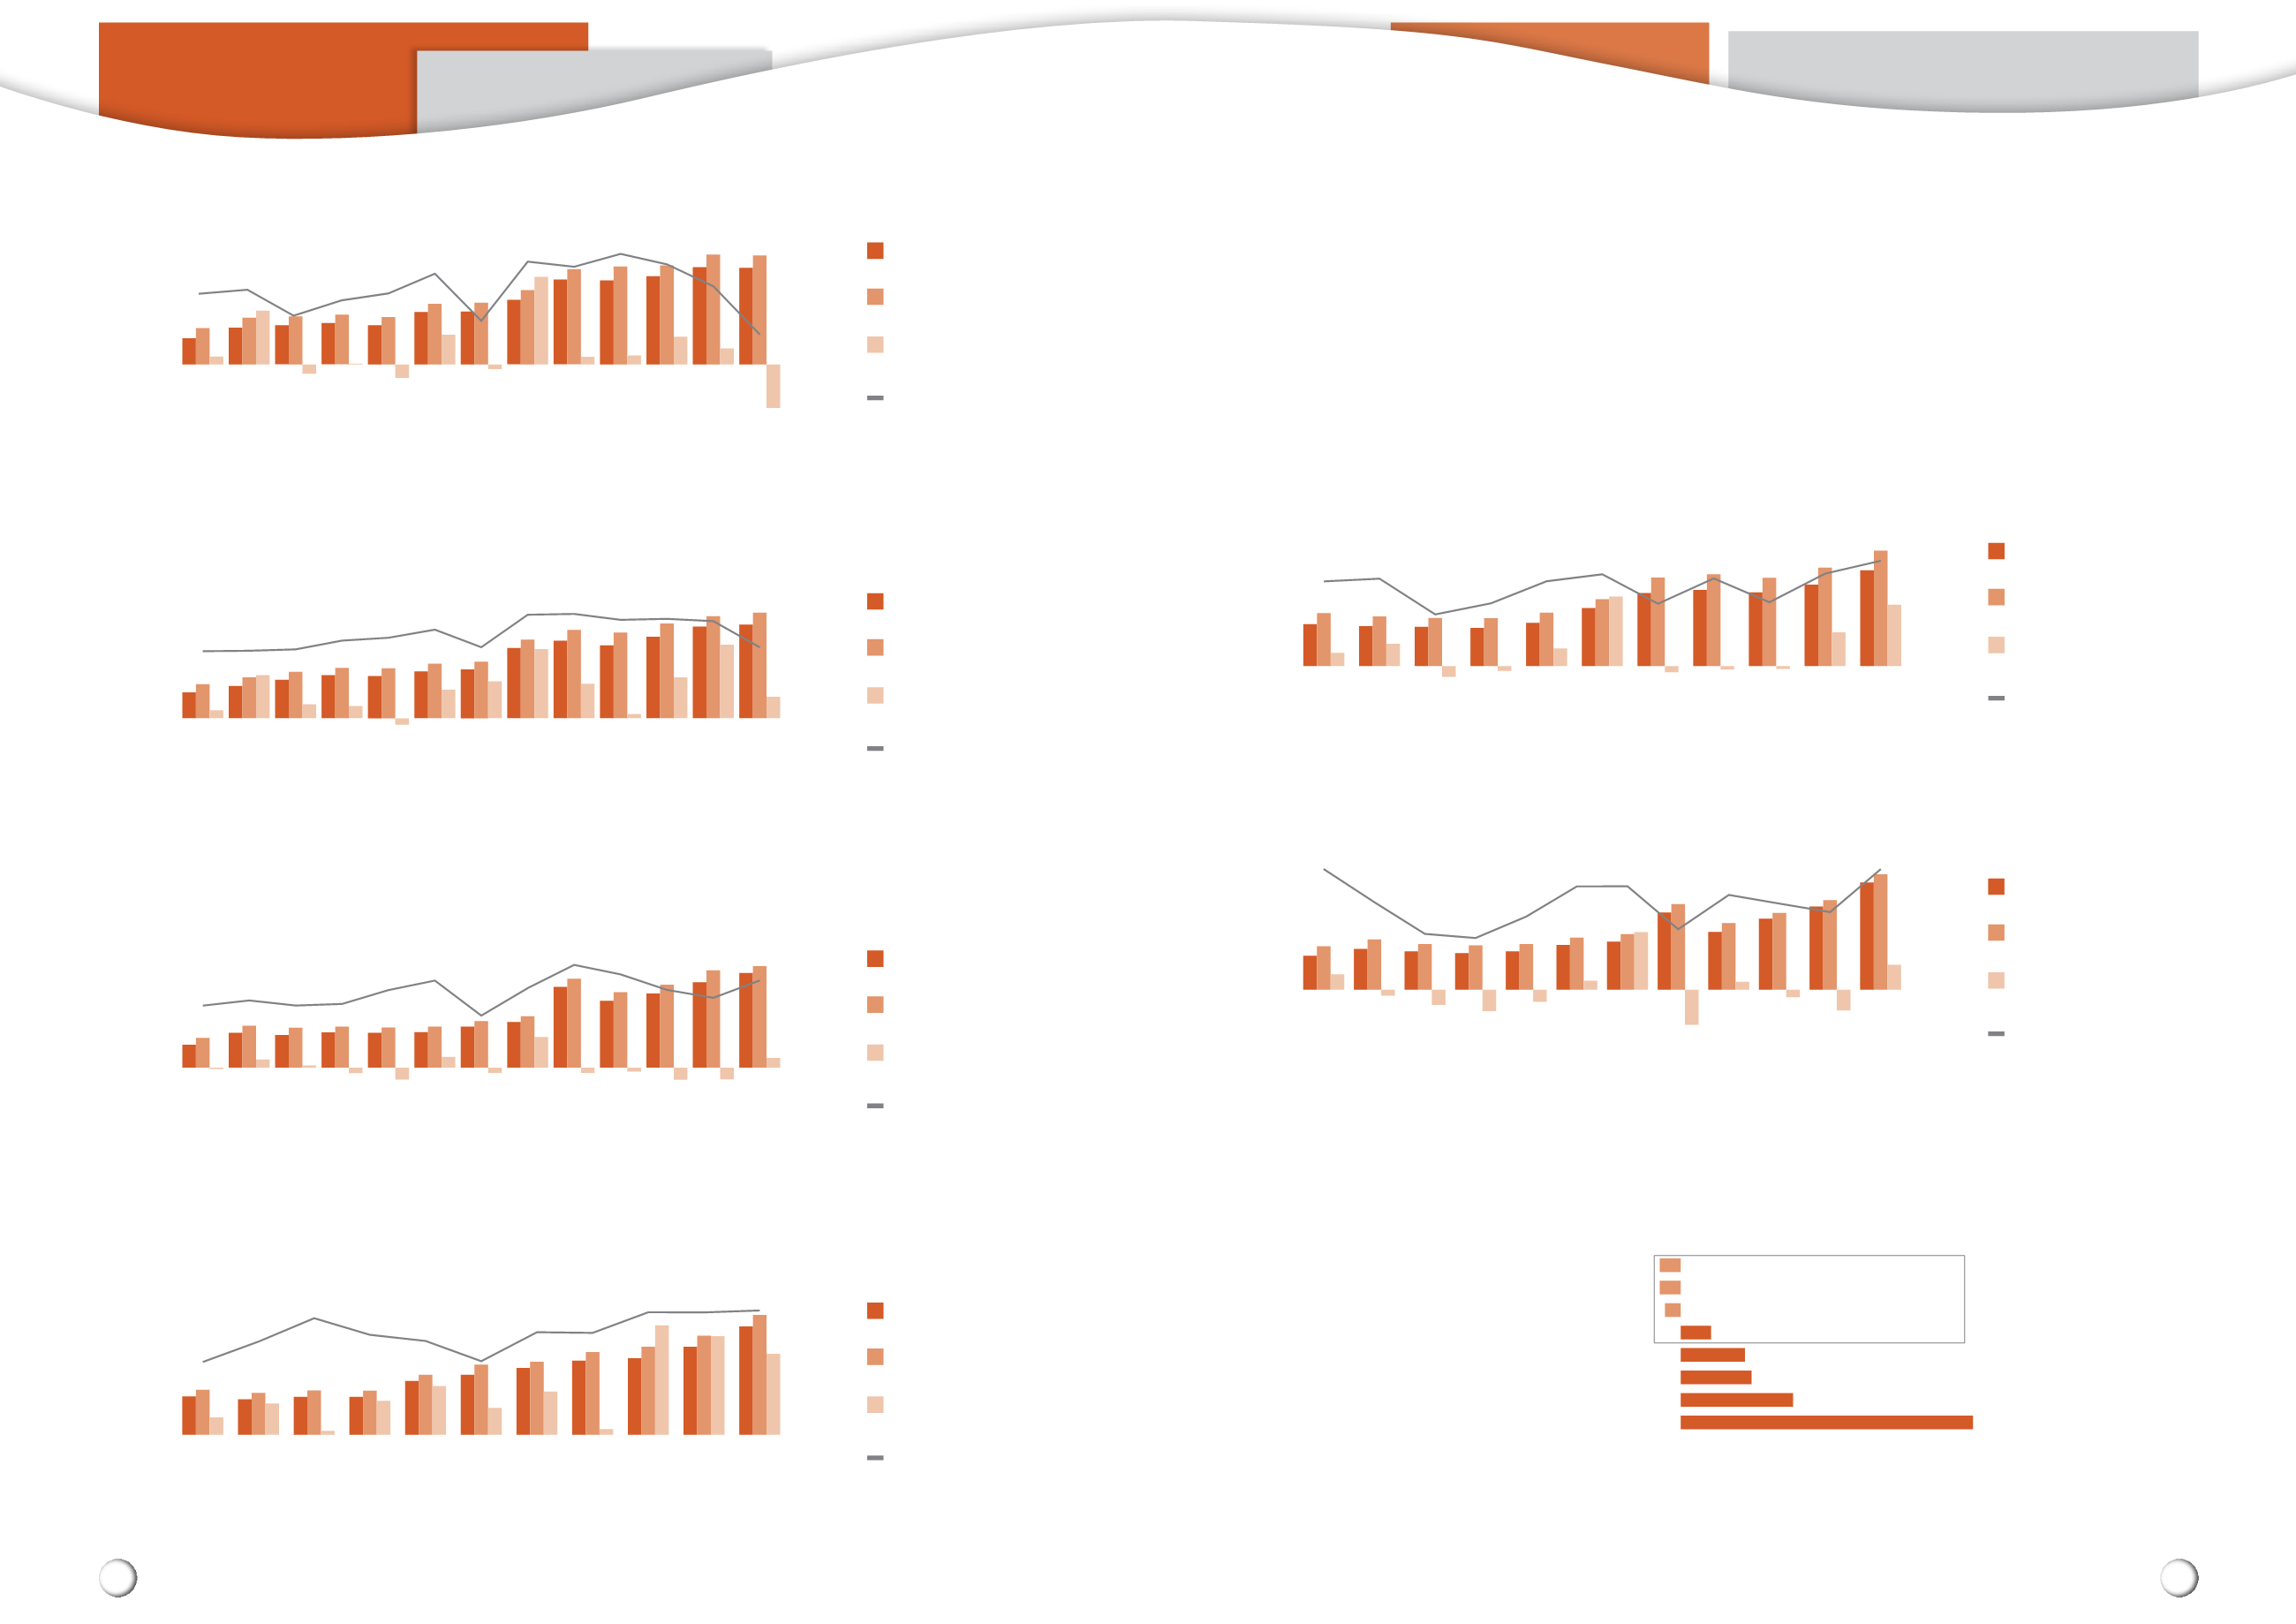
Graph 5: Actual production cost, yield and profit/loss of wheat in the Southern Cape
Grafiek 5: Werklike produksiekoste, opbrengs en wins/verlies van koring in die Suid-Kaap
4,5
4
3,5
3
2,5
2
1,5
1
0,5
0
7 000
6 000
5 000
4 000
3 000
2 000
1 000
0
-1 000
R/ha
T/ha
Source/
Bron
: Grain SA/
Graan SA
Total variable cost
Totale lopende koste
Profit/loss per hectare
Wins/verlies per hektaar
Total cost per hectare
Totale koste per hektaar
Yield (tons/ha)
Opbrengs (ton/ha)
2002
2003
2004
2005
2006
2007
2008
2009
2010
2011
2012
Graph 6: Actual production cost, yield and profit/loss of wheat in the Eastern Free State
Grafiek 6: Werklike produksiekoste, opbrengs en wins/verlies van koring in die Oos-Vrystaat
3
2,5
2
1,5
1
0,5
0
8 000
6 000
4 000
2 000
0
-2 000
-4 000
R/ha
T/ha
Source/
Bron
: Grain SA/
Graan SA
Total variable cost
Totale lopende koste
Profit/loss per hectare
Wins/verlies per hektaar
Total cost per hectare
Totale koste per hektaar
Yield (tons/ha)
Opbrengs (ton/ha)
2001
2002
2003
2004
2005
2006
2007
2008
2009
2010
2011
2012
Graph 7: The profitability (gross margin) of grain and oilseeds in R/ha for different yield scenarios
in the North-West Free State environment (2014/2015 production season)
Grafiek 7: Die winsgewendheid (bruto marge) van graan en oliesade in R/ha vir verskillende
opbrengsscenario’s in die Noordwes-Vrystaat-omgewing (2014/2015-produksieseisoen)
* – The Safex futures contracts used in this scenario calculation for maize delivery in July 2015 was R2 000/ton
– Estimated variable and fixed costs were taken into consideration.
* –
Die Safex-termynkontrakte wat in hierdie scenarioberekening vir mielielewering in Julie 2015 gebruik is, was R2 000/ton
– Beraamde veranderlike en vaste koste is in ag geneem.
-500
500
1 500
2 500
3 500
4 500
5 500
6 500
7 500
Gross margin (R/ha)/
Bruto marge (R/ha)
Maize – lower yield/
Mielies – laer opbrengs
Maize – average yield/
Mielies – gemiddelde opbrengs
Maize – average yield (minimum tillage)/
Mielies – gemiddelde opbrengs (minimum bewerking)
Maize – higher yield/
Mielies – hoër opbrengs
Grainsorghum – average yield/
Graansorghuim – gemiddelde opbrengs
Sunflower – average yield/
Sonneblom – gemiddelde opbrengs
Soybeans – average yield/
Sojabone – gemiddelde oprengs
Groundnuts – average yield/
Grondbone – gemiddelde opbrengs
-2 728
-1 432
-379
731
1 566
1 697
2 721
7 142
Maize scenarios/
Mielie-scenario's
5
4,5
4
3,5
3
2,5
2
1,5
1
0,5
0
6 000
5 000
4 000
3 000
2 000
1 000
0
-1 000
-2 000
-3 000
R/ha
T/ha
Graph 1: Actual production cost, yield and profit/loss of maize for the North West Province
Grafiek 1: Werklike produksiekoste, opbrengs en wins/verlies van mielies in die Noordwes Provinsie
2000/2001
2001/2002
2002/2003
2003/2004
2004/2005
2005/2006
2006/2007
2007/2008
2008/2009
2009/2010
2010/2011
2011/2012
2012/2013
Source/
Bron
: Grain SA/
Graan SA
Total variable cost
Totale lopende koste
Profit/loss per hectare
Wins/verlies per hektaar
Total cost per hectare
Totale koste per hektaar
Yield (tons/ha)
Opbrengs (ton/ha)
7
6
5
4
3
2
1
0
8 000
7 000
6 000
5 000
4 000
3 000
2 000
1 000
0
-1 000
R/ha
T/ha
2000/2001
2001/2002
2002/2003
2003/2004
2004/2005
2005/2006
2006/2007
2007/2008
2008/2009
2009/2010
2010/2011
2011/2012
2012/2013
Source/
Bron
: Grain SA/
Graan SA
Total variable cost
Totale lopende koste
Profit/loss per hectare
Wins/verlies per hektaar
Total cost per hectare
Totale koste per hektaar
Yield (tons/ha)
Opbrengs (ton/ha)
Graph 2: Actual production cost, yield and profit/loss of maize in the North-West Free State
Grafiek 2: Werklike produksiekoste, opbrengs en wins/verlies van mielies in die Noordwes-Vrystaat
Graph 3: Actual production cost, yield and profit/loss of maize in the Eastern Free State
Grafiek 3: Werklike produksiekoste, opbrengs en wins/verlies van mielies in Oos-Vrystaat
6
5
4
3
2
1
0
10 000
8 000
6 000
4 000
2 000
0
-2 000
R/ha
T/ha
2000/2001
2001/2002
2002/2003
2003/2004
2004/2005
2005/2006
2006/2007
2007/2008
2008/2009
2009/2010
2010/2011
2011/2012
2012/2013
Source/
Bron
: Grain SA/
Graan SA
Total variable cost
Totale lopende koste
Profit/loss per hectare
Wins/verlies per hektaar
Total cost per hectare
Totale koste per hektaar
Yield (tons/ha)
Opbrengs (ton/ha)
Graph 4: Actual production cost, yield and profit/loss of maize in KwaZulu-Natal
Grafiek 4: Werklike produksiekoste, opbrengs en wins/verlies van mielies in KwaZulu-Natal
9
8
7
6
5
4
3
2
1
0
12 000
10 000
8 000
6 000
4 000
2 000
0
R/ha
T/ha
2002/2003
2003/2004
2004/2005
2005/2006
2006/2007
2007/2008
2008/2009
2009/2010
2010/2011
2011/2012
2012/2013
Source/
Bron
: Grain SA/
Graan SA
Total variable cost
Totale lopende koste
Profit/loss per hectare
Wins/verlies per hektaar
Total cost per hectare
Totale koste per hektaar
Yield (tons/ha)
Opbrengs (ton/ha)
Production research and development
Produksienavorsing en -ontwikkeling


