59
Continued on page 60
SPI at different time scales is calculated to monitor the development of
drought conditions.
Figure 1
shows the SPI for one month precipitation (top) through longer
periods to a 24-month SPI (bottom), with classifications of dry and wet
conditions according to the SPI scale.
Dry conditions during March this year indicated a meteorological drought
in the mild to moderate category over large parts of the summer rainfall re-
gion. Due to dry conditions since January, however, large areas were expe-
riencing agricultural drought in the moderate category for the three-month
period January 2013 to March 2013 (second map from top in Figure 1).
Taken over the main summer rainfall season of October 2012 to
March 2013, the lack of early season rainfall over much of the North West
Province caused the six-month SPI to be indicative of moderate to severe
drought conditions (third map from top), with a larger focus towards the
western parts of the North West Province, as early summer rainfall was
normal to above-normal over the eastern parts of the province.
Over the entire summer rainfall season, including the marginal periods,
the twelve-month SPI up until June 2013, is indicative of a moderate to
severe drought over a large area centred over the western part of the
North West Province (fourth map from top).
At this time scale, hydrological impacts (as reflected in the levels of med-
ium to large reservoirs and groundwater tables) also become important,
over and above agricultural impacts. When taking the previous summer
rainfall season into account, the cumulative effect of two successive dry
summers immediately becomes apparent (bottom map).
While some parts of the North West Province and the Free State are clas-
sified as experiencing moderate drought, large parts of both provinces
are actually experiencing severe drought conditions. Centred over the
western part of the North West Province, a large area is shown to be
experiencing extreme drought conditions at this time scale. This area in-
cludes Taung, where drinking water is being supplied by tankers as the
main reservoir has run dry.
Vegetation responses during 2013 reflect the effects of the drought condi-
tions, indicating the focus area to be over the western parts of the North
West Province.
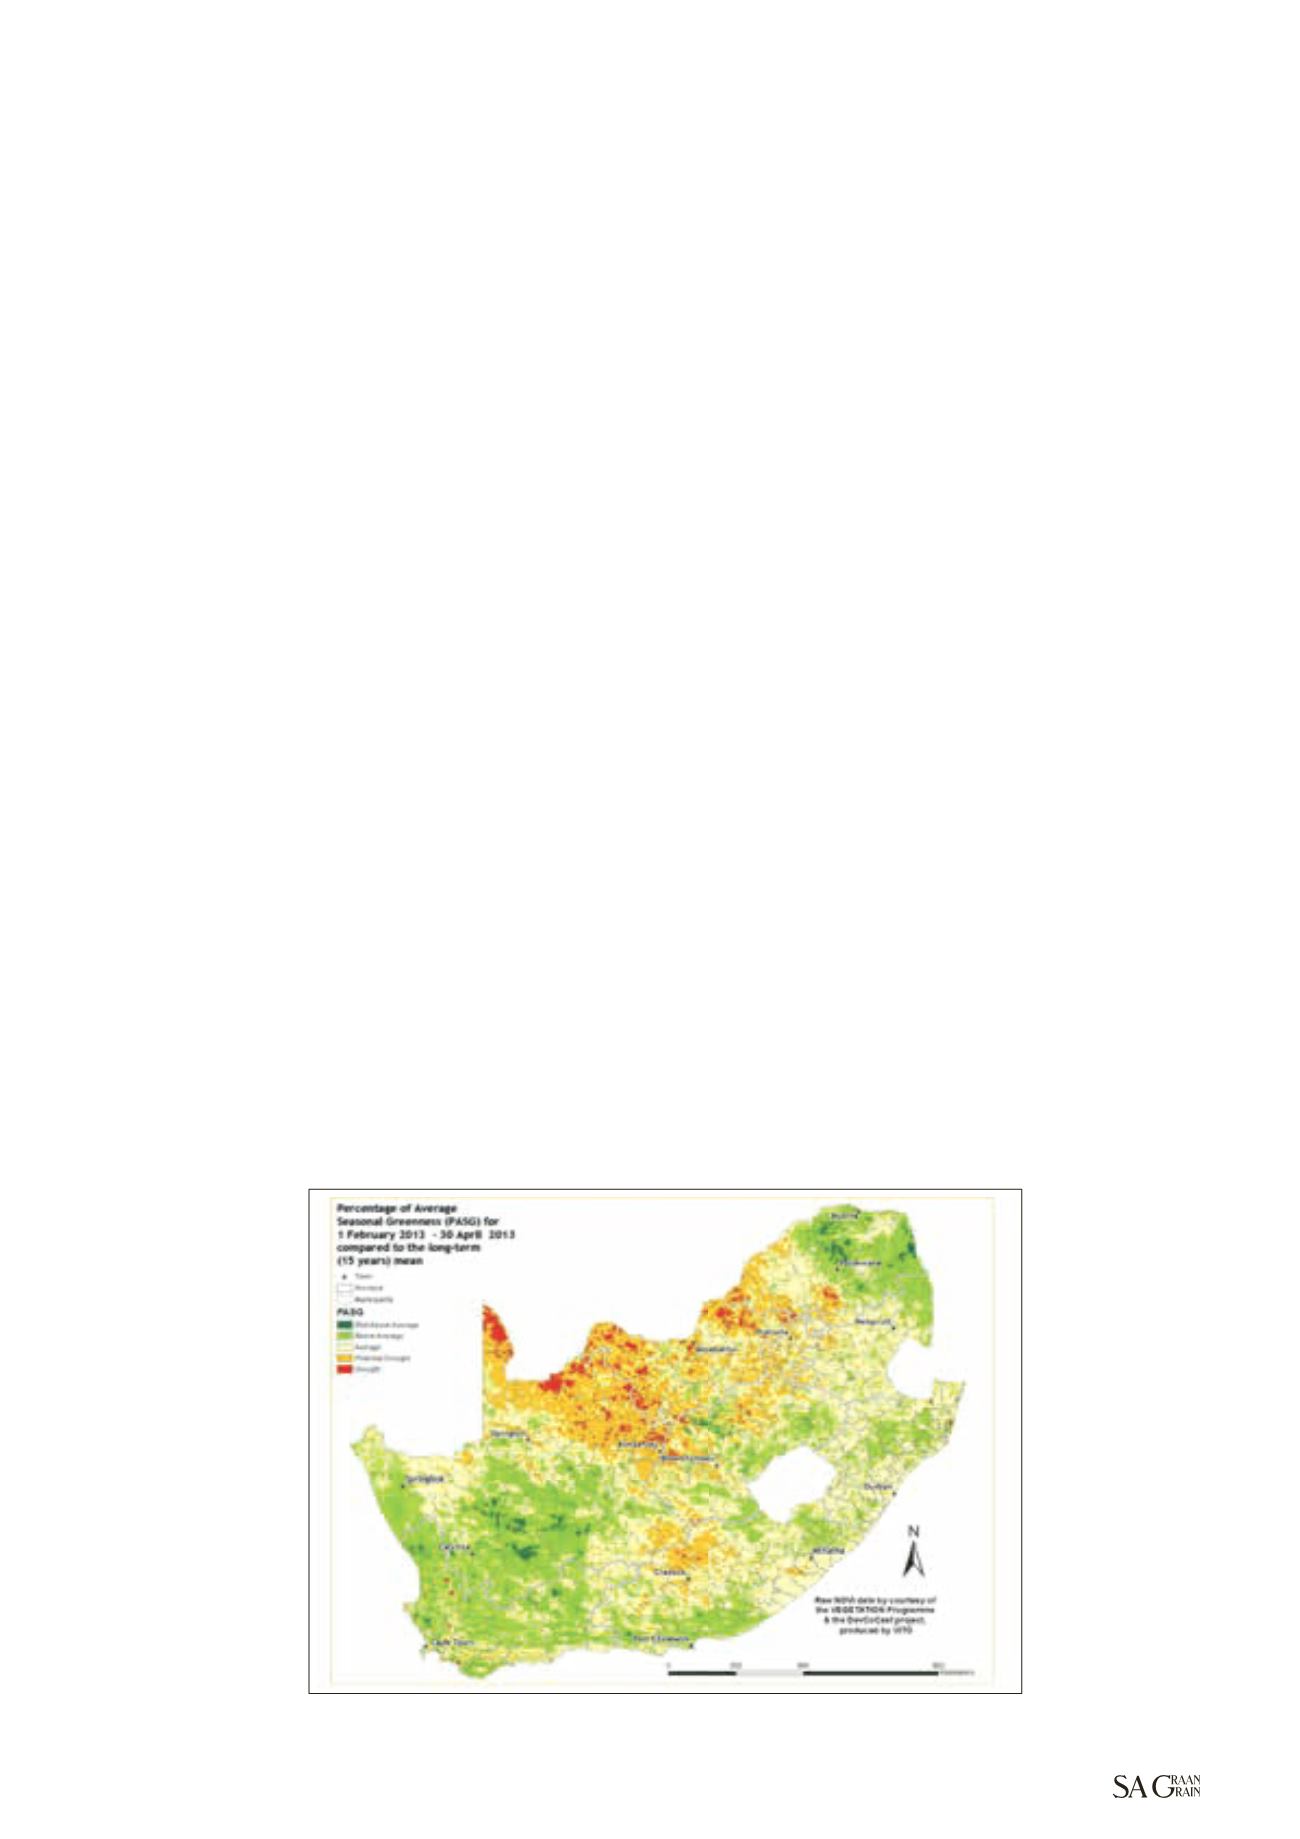
Figure 2
shows the Percentage of Average Seasonal
Figure 2: Percentage of Average Seasonal Greenness (PASG) for the three month period of February 2013
to April 2013.
Greenness (PASG), a measure of the total cumulative vegetation activity
compared to the long-term mean.
The PASG during late summer (February 2013 - April 2013) clearly indi-
cates the effect of dry conditions as large deficits in vegetation activity
throughout this important part of the summer growing season. Due to
hot and dry weather through most of the January to March period, cu-
mulative vegetation activity over the North West Province and adjacent
areas was indicative of drought stress.
The two most severely impacted areas were the western part of the
North West Province into north eastern Northern Cape and also a more
scattered region over the northern parts of the North West Province into
southern Limpopo. These areas were also indicated by the three-month
SPI to be affected by moderate drought conditions.
While rainfall conditions according to the SPI, indicated only moderate
drought conditions over many of these areas, once again the cumula-
tive effect of two consecutive dry summers may play a role in these
large negative responses in vegetation activity.
The North West Province and surrounding area was part of a much larger
region negatively affected by drought during 2013. While most of the
eastern and southern parts of South Africa experienced a rather wet
summer and above-normal vegetation activity, large parts of the south-
western SADC region were experiencing dry conditions.
Drought conditions over Southern Africa are regularly linked to the
El Niño – Southern Oscillation (ENSO). Large-scale droughts tend to occur
during ENSO warm events (El Niño conditions, e.g. 1982/1983, 1991/1992,
2006/2007). However, the drought that developed during 2012/2013 was
not associated with such an event.
Over South Africa specifically, it was certainly not one of the most exten-
sive droughts on record. Several droughts in the past covered a larger
part of the summer rainfall region and were more intense during the
January - March period.
Figure 3
presents a rainfall decile map for the
SADC region showing rainfall categories for the October - March period.
A decile of one means that rainfall for the period falls within the lowest
10% category experienced historically (in this case since 1983). Accord-
ing to the rainfall estimate map, rainfall over large parts of Botswana,
November 2013


