Market overview
Markets
A look at the grain and oilseeds
market, with an overview of the
sunflower industry
WANDILE SIHLOBO AND FUNZANI SUNDANI, BOTH ECONOMISTS AT INDUSTRY
SERVICES, GRAIN SA
The recent USDA report has significantly affected grain and oilseed
prices. The report supported soybean and corn prices, but wheat prices
experienced pressure. This article will take a look at the domestic and
international markets for grain and oilseeds, the exchange rate as well as
a brief overview of the South African sunflower seed market.
International markets
Corn
According to the recent WASDE (World Agricultural Supply and Demand
Estimates) report, the US production of corn is lower than expected
at 355,3 million tons. It is still 30% well above last year’s 273,8 million
tons. The expected large crop in the Ukraine and the favourable weather
conditions during harvest in the US add to price pressure. However,
increases in feed usage as well as increases in exports led to price
support for corn. South Korea, Japan, China and Mexico are countries
that have shown an increase in the demand for US corn.
It is important to note that the corn price fundamentals are not strong
enough to sustain corn price levels. The relatively high soybean price
needs to be respected by traders in order to ensure sufficient corn
plantings, thus the higher corn prices.
Soybeans
Although South America is expecting a large crop, increased demand for
soybeans helped to underpin prices. China, Egypt and Thailand showed
an increase in demand. There are expectations that China’s soybean
imports may reach a record of 69 million tons as compared to 59,5 million
tons the previous year. Keep in mind that the excellent export price for
soybeans and low expected carry-out, underpins feed grain prices.
The critical months for soybean production in Argentina are during
January and February and therefore uncertainty about future crop
conditions is outstanding.
Wheat
Wheat prices have been trading down with expectations of a larger crop
from the world market. Decreases in exports compared to corn and
soybeans exports, lead to lower prices. It is expected that milling quality
wheat will only recover in the second quarter of 2014.
Sunflower
Sunflower harvests have been slower than usual in some of the key
producing areas in the US. However, Russia’s 2013 sunflower harvest
yielded 7,8 million tons compared to 7,2 million tons the previous year.
There has been some increased demand for sunflower oil, mainly from
Egypt. Favourable weather conditions in Argentina helped in aiding their
2013/2014 sunflower seed plantings, with the planting pace reported to
be higher than the previous year while the weather conditions for planting
started out dry.
Vegetable oil prices are supported by an increase in palm oil prices and
the damage by weather events in South East Asia. The higher soy-oil and
oilcake prices also lend support.
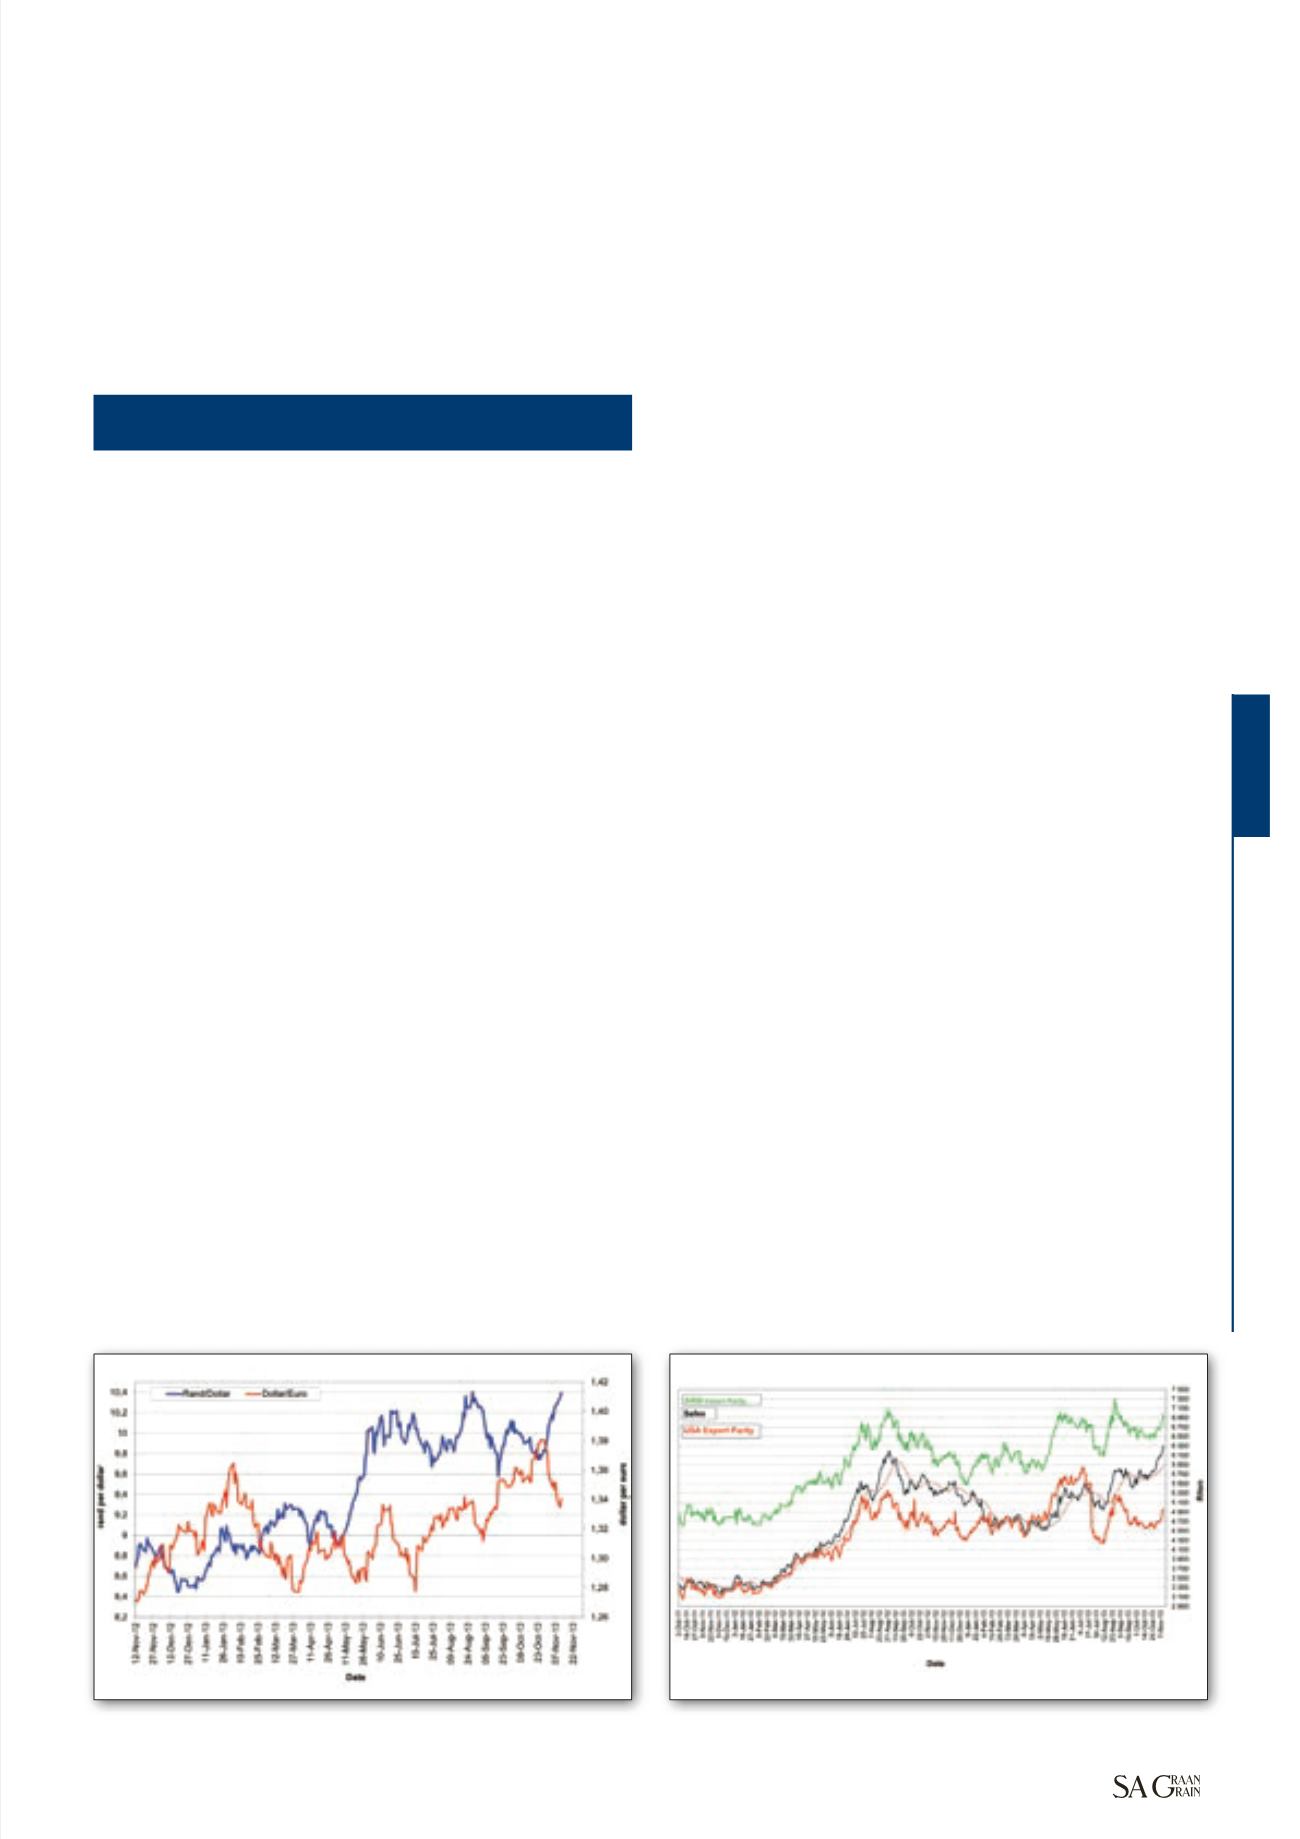
Exchange rate movements
Since last year, the rand has been very volatile, recently reaching high
levels of R10,42 against the dollar. It is expected that the rand will weaken
further until the second quarter of 2014.
The recent pressure on the rand and other emerging market currencies,
is mainly due to the expectations that the United States Federal Reserve
(US Fed) might start tapering its $85 billion a month stimulus earlier than
expected. The recent report by the United States Commerce Department
that the US economy grew at a higher rate of 2,8% in the third quarter
of 2013, compared to 2,5% in the second quarter, coupled with better
employment data, raised concerns that the US Fed might start tapering
in December 2013, instead of March 2014, as previously expected.
Consequently, the dollar strengthened as investors renew their trust in
the US economy (
Graph 1
).
Domestic markets
Maize exports
Recently, South African maize exports have mainly been going to the
BLNS countries as well Zimbabwe. Zimbabwe is expected to import about
39
December 2013
– 13 November 2013
Graph 1: Exchange rate movement.
Source: Grain SA (2013)
Graph 2: Prices of soybean delivered in Randfontein.
Source: Grain SA (2013)
Continued on page 40


