Meat
Markets
Looking at livestock prices for 2014
ERNST JANOVSKY, HEAD: AGRIBUSINESS, ABSA
The livestock feed industry is a major consumer of grain and oilseeds.
Without a profit expectation for this industry, the consumption of
livestock feed will decline and that will be negative for grain and oilseeds
producers.
Profit is derived from the product prices as well as the cost of production.
Let us investigate the expectations of the major livestock enterprises.
Beef
The good old times where real beef prices increased in spite of an
increase in slaughtering, is something of the past and we are once again
back to normal. There has always been a strong correlation between beef
slaughtering and real beef prices – as slaughtering increased, real beef
prices declined. However, during the period of 2000 to 2006, as a result
of good international economic growth as well as domestic economic
growth, real beef prices increased in spite of an increase in slaughtering.
Since then, we experienced the world financial crisis and in South Africa
a slowdown in economic growth which implies that consumers are taking
strain. The net effect is that as spending continued to increase, real beef
prices continued to decline.
The future however does not look as rosy, as far above average
production conditions over the past five years created some leeway in a
sense that producers did not need to slaughter their cattle as there was
enough fodder available to carry stock over. All of this however changed
dramatically during the past season given the first indicative drought in
the western areas of the country, this combined with a severe dry year in
Namibia and one of the biggest herds we have ever had in South Africa,
has led to a sharp increase in slaughtering.
An above average rain season can bring some relief, but given the long-
term prediction, it is expected that we are moving into a dryer rainfall
cycle. We therefore expect slaughtering to increase as producers start to
cut back on production and we also expect that the national beef herd will
be under pressure and start to shrink.
As communal areas’ contribution to total slaughtering has increased
substantially over the past years, it is expected that given the level
of fodder management, communal producers would be much more
vulnerable to the effects of a drought than commercial producers as they
do not have any reserves whether financial or in the form of fodder.
Lower world commodity prices for coarse grains lead to a lowering of
feed prices, unfortunately this was to some extend set off by a weaker
rand/dollar exchange rate. Intensive livestock industries, such as feedlots,
therefore continue to take some strain.
Beef outlook
Slaughtering is expected to continue to increase over the next few years
placing downward pressure on producer prices as demand is expected
to remain fairly flat. Class A2 beef prices are expected to decline from the
anticipated R31/kg in December, to just below R27/kg in May 2014.
Weaner calf prices are expected to show some recovery, but will struggle
to exceed R18,50/kg in live weight in 2014.
Mutton
World sheep numbers continue to decline; this is mainly due to the dry
production conditions in Australia triggering herd liquidation, with a
resulting decline in world mutton production.
On the domestic front the national sheep is showing some recovery
nationally after reaching a low during 2010 which coinside with the
outbreak of Rift Valley fever which led to a decline of almost 30% in
mutton production. Due to the decline in production, prices peaked at a
new all-time record of R54,55/kg for Class A2 in August 2011.
Production recovered to pre-2011 prices during the 2012 season, with
the bulk of the producers now inoculating against Rift Valley fever. Herd
numbers have also shown some recovery as producers muster the art of
keeping their flocks safe from vermin and stock theft.
41
December 2013
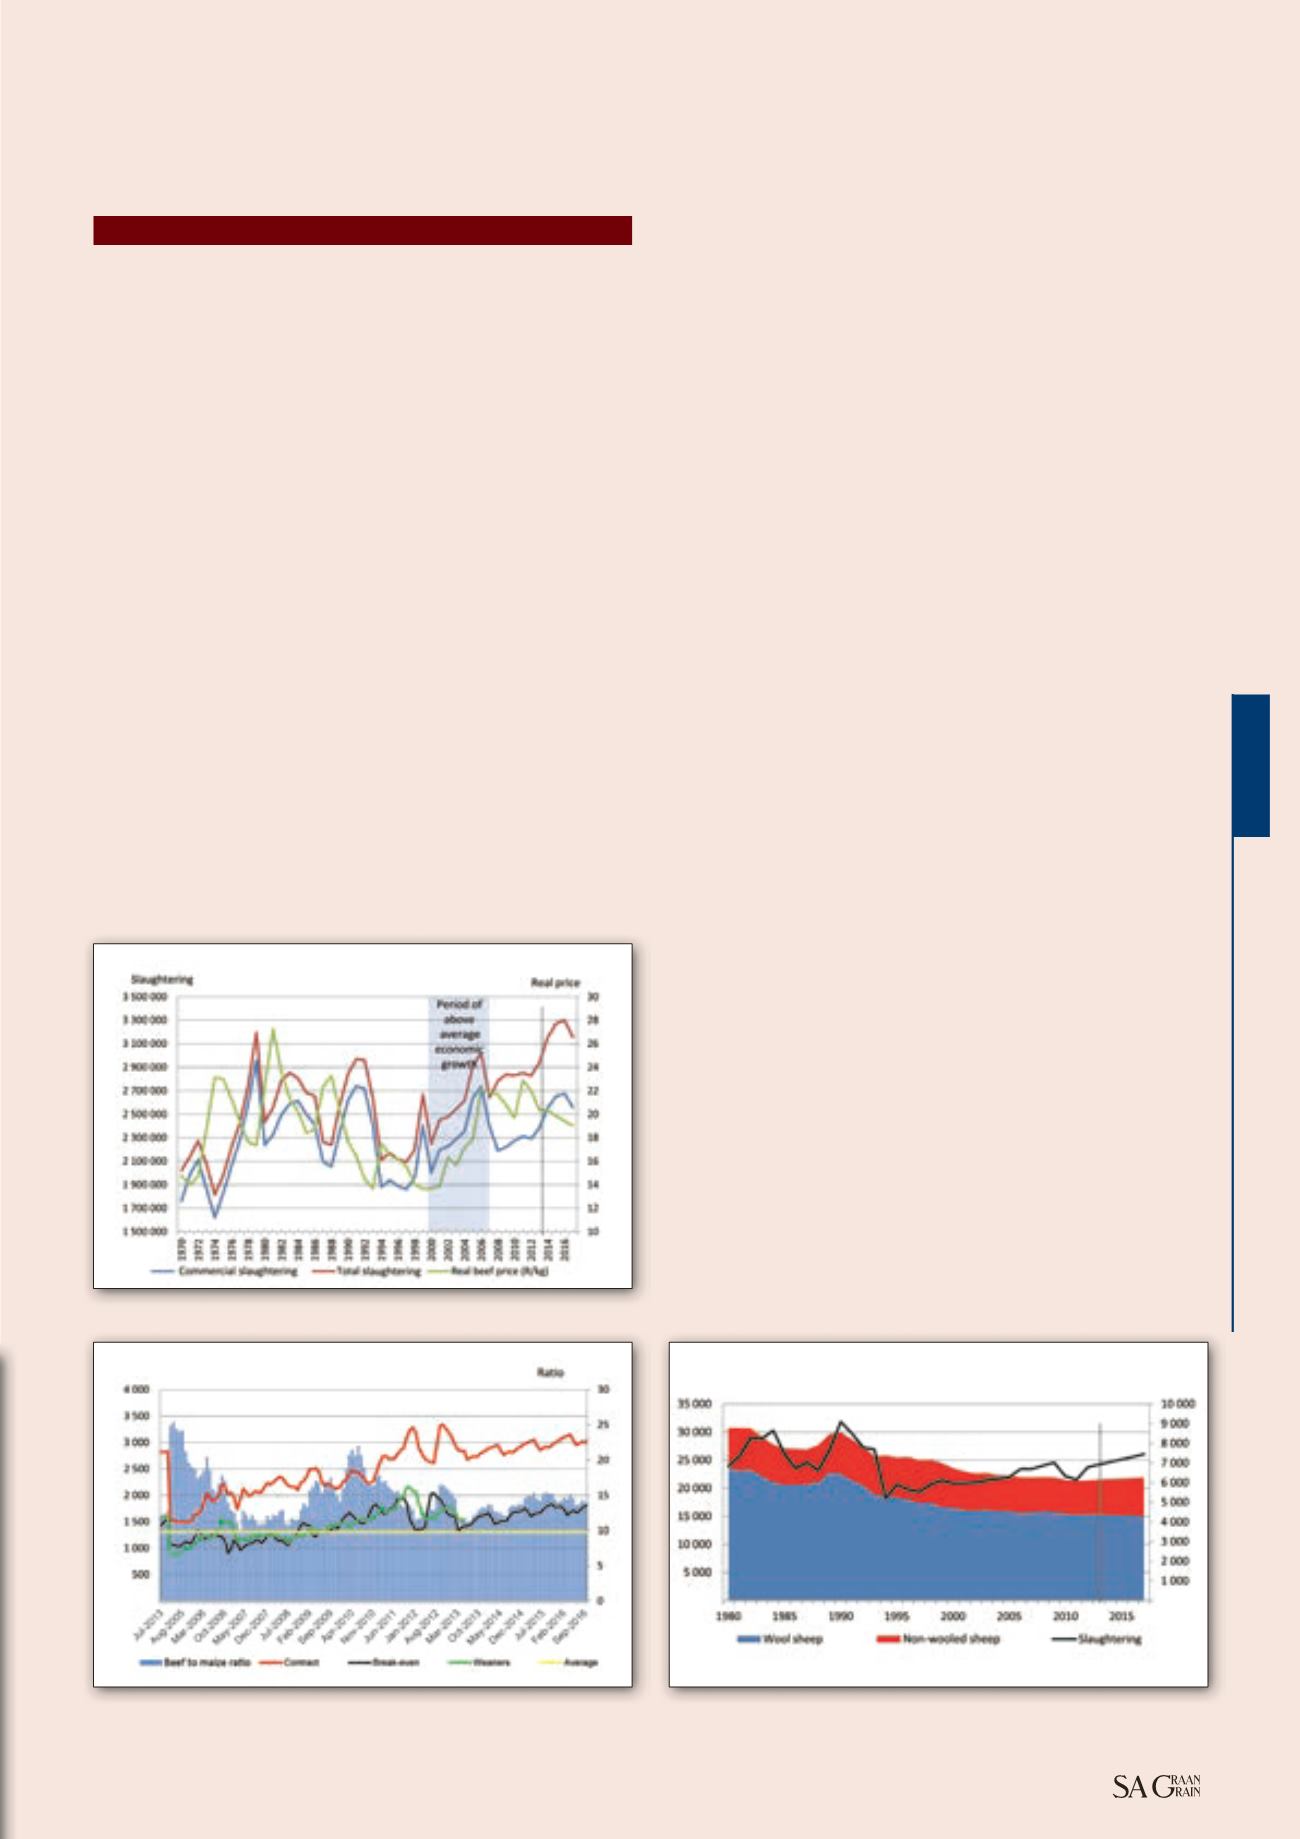
Graph 1: Relation between beef slaughtering and real beef prices (2008 = base).
Graph 2: Relation between maize and weaner calf prices (c/kg).
Graph 3: South African sheep herd and slaughtering (‘000).
Continued on page 42


