Meat
Markets
Desember 2013
42
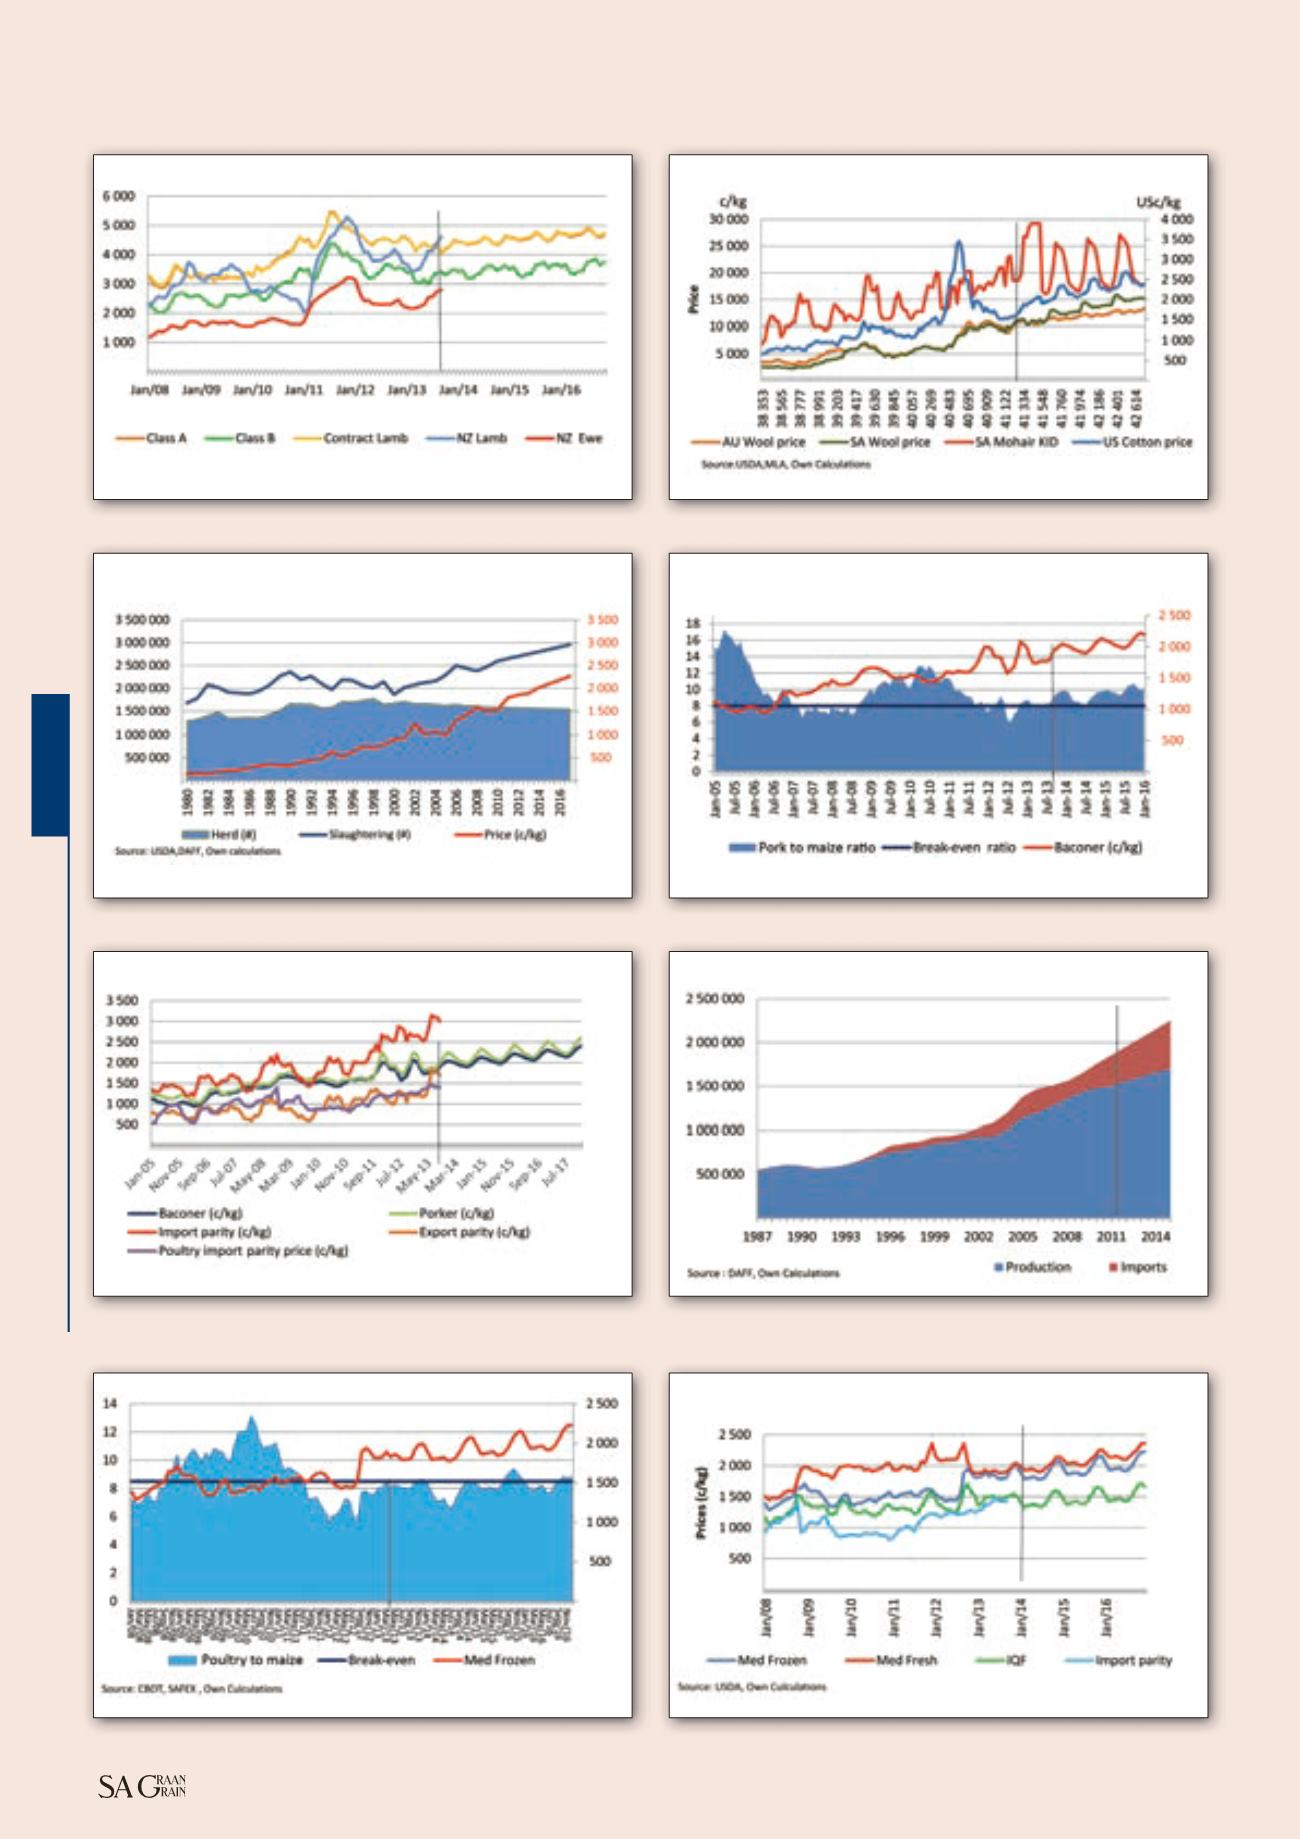
Graph 4: Domestic mutton prices (c/kg).
Graph 6: Relationship between pork slaughters, herd and price.
Graph 10: Relation between poultry and maize prices.
Graph 8: Relationship between domestic pork, import, export poultry parity
prices (ZAR c/kg).
Graph 5: Fibre prices.
Graph 7: Pork to maize price ratio.
Graph 11: Poultry prices.
Graph 9: South African poultry production and imports (‘000 t).
Looking at livestock prices for 2014
Continued from page 41


