35
December 2013
A production cost comparison between
barley and wheat
Due to the limited space available, only the budgeted production data
of Douglas (supplied by GWK) is listed in this article, but the actuals as
well as the data for Vaalharts (supplied by Senwes) are available in the
full study.
Table 1
is the budgeted production cost data supplied by GWK (2013).
The variable input cost data of GWK was once again used in
Table 2
. On
this basis, net profit is compared in
Table 3
.
Quality assessment
Fairly unique to the South African environment, grading is done on a
sliding scale with multiple intervals and the producers are rewarded for
better quality. Aspects such as the percentage of plump kernels, nitrogen
levels, moisture levels, screenings and foreign matter are all based on
sliding scales. According to SAB (2013), producers were paid on average,
R329/ton in the GWK area and R312/ton in the Vaalharts area.
Production and logistics
Interviews with stakeholders revealed many different issues regarding
the production process. The more important ones are listed below:
Pests
More than once it was stated that the fact that barley is not susceptible
to fusarium is a huge benefit. This is particularly true for those producers
that have fusarium problems in respect of their wheat. Barley is also not
affected by take-all (
vrotpootjie
).
Nitrogen application
In the past it was considered cheaper to produce barley, since the
nitrogen application was less, 30 kg/ha - 40 kg/ha compared to wheat’s
250 kg/ha. Nowadays, the gap has narrowed and new cultivars could
require 130 kg/ha - 140 kg/ha.
Water management
Producers in Vaalharts have specifically mentioned that barley requires
better management of water. Directly after being irrigated, the kernels
are heavy and if the wind then starts to blow there is a real danger of
lodging since the stem is top-heavy. This means that, day or night, the
pivot has to be switched off.
Lodging
Lodging appears to be a very contentious issue, particularly from a
producer’s perspective. Barley could yield 7 tons - 8 tons, but if lodging
occurs it could be down to 5 tons.
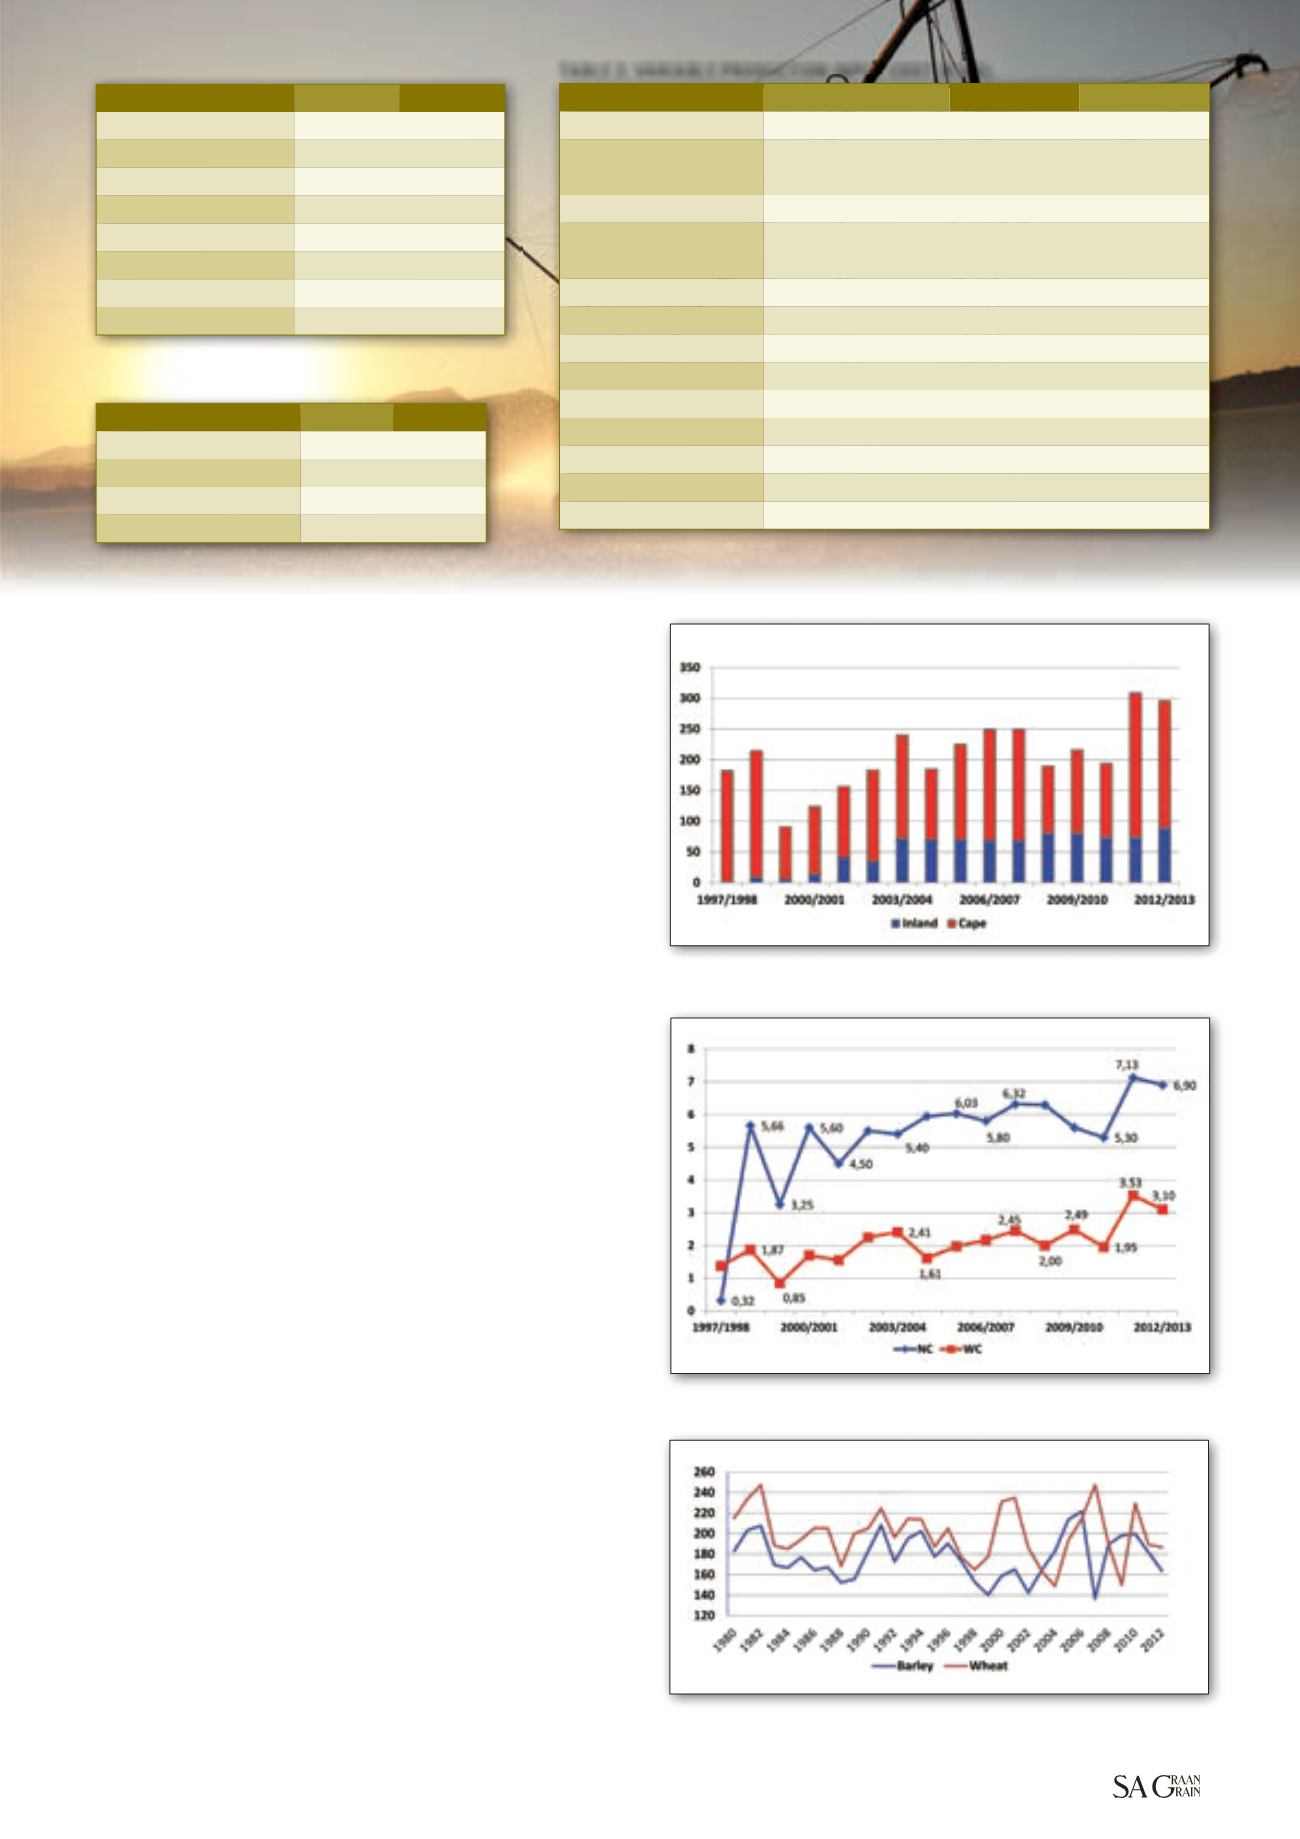
Graph 1: South African barley production, 1997/1998 to 2012/2013 (‘000 tons).
Source: DAFF, 2013
Graph 2: South African barley yields per hectare.
Source: DAFF, 2013
Graph 3: Barley and wheat producer prices (real).
Source: Agricultural Abstract, 2013
Barley
Wheat
Safex prices
3 310
3 310
Transport differential
-256
-325
B2 deduction
-135
-135
8% factor
-234
Premium/upgrades
250
Net price per ton
2 935
2 850
Yield (tons/ha)
6,5
6,5
Turnover per hectare
19 080
18 525
TABLE 1: YIELD AND TURNOVER (R/HA).
Source: GWK, 2013
Source: GWK, 2013
Source: GWK, 2013
Barley
Wheat
Fuel
563
563
Fertiliser
Barley 150 kg/ha N
Wheat 250 kg/ha N
5 665
7 353
Micro-elements
910
839
Seed
Barley 80 kg/ha
Wheat 100 kg/ha N
768
1 180
Weed and pest control
364
1 143
Insurance
1 049
1 018
Harvesting cost
1 002
1 002
Irrigation cost
2 420
2 420
Mechanisation
402
402
Pivot cost
350
350
Total cost per hectare
13 496
16 279
Yield
6,5
6,5
Total cost per ton
2 076
2 504
TABLE 2: VARIABLE PRODUCTION INPUT COST (R/HA).
Barley
Wheat
Turnover per ton
2 935
2 850
Input cost per ton
2 076
2 504
Net profit per ton
859
346
Gross profit per hectare
5 584
2 246
TABLE 3: PROFIT COMPARISONS.
Continued on page 36
SA Graan/
Sasol Nitro fotokompetisie
– Sanett Botha 2012


