
Oktober 2016
58
Disclaimer
Everything has been done to ensure the accuracy of this information, however Grain SA takes no responsibility for
any losses or damage incurred due to the use of this information.
UPDATED:
25 AUGUST 2016
SAGIS:
25 AUGUST 2016
GRAIN SA ESTIMATES:
25 AUGUST 2016
GRAIN SA PROJECTIONS:
25 AUGUST 2016
MARKETING YEAR
2014/2015
2015/2016
2016/2017
Area planted (x 1 000 ha)
477
482
498
Yield (t/ha)
3,67
3,02
3,38
Crop Estimates Committee (CEC) crop estimate
(‘000 ton)
1 750
1 457
1 683
Retentions and production of seed
0
35
35
Minus: Early deliveries 2015
13
13
13
Plus: Early deliveries 2016
13
13
13
Available for commercial deliveries
1 750
1 422
1 648
SAGIS
('000 TON)
GRAIN SA
('000 TON)
GRAIN SA
('000 TON)
Commercial supply
Opening stocks (1 October)
489
597
813
Commercial production
1 700
1 422
1 648
Surplus (adjustment of the reconciliation)
15
Imports
1 832
2 000
1 600
Total commercial supply
4 036
4 019
4 061
Commercial demand
Commercial consumption
Food
3 109
3 100
3 085
Feed
4
3
23
Total
3 113
3 103
3 108
Other consumption
Gristing
Withdrawn by producers
1
4
3
Released to end consumers
3
4
4
Seed for planting purposes
23
21
19
SAGIS
7
0
11
Total
34
29
38
Total South African consumption
3 147
3 132
3 146
Exports
Products
18
18,7
18,85
Whole wheat
274
56
215,95
Total
292
75
235
Total demand
3 439
3 206
3 381
Carry-out (30 September)
596,8
813
680
Pipeline requirements
681
679
676
Surplus above pipeline
-85
133
4
% imported of South African consumption
58,2%
63,9%
50,9%
Carry-out as a % of South African consumption
19%
26%
21,6%
Carry-out as a % of total commercial demand
17,4%
25,3%
20,1%
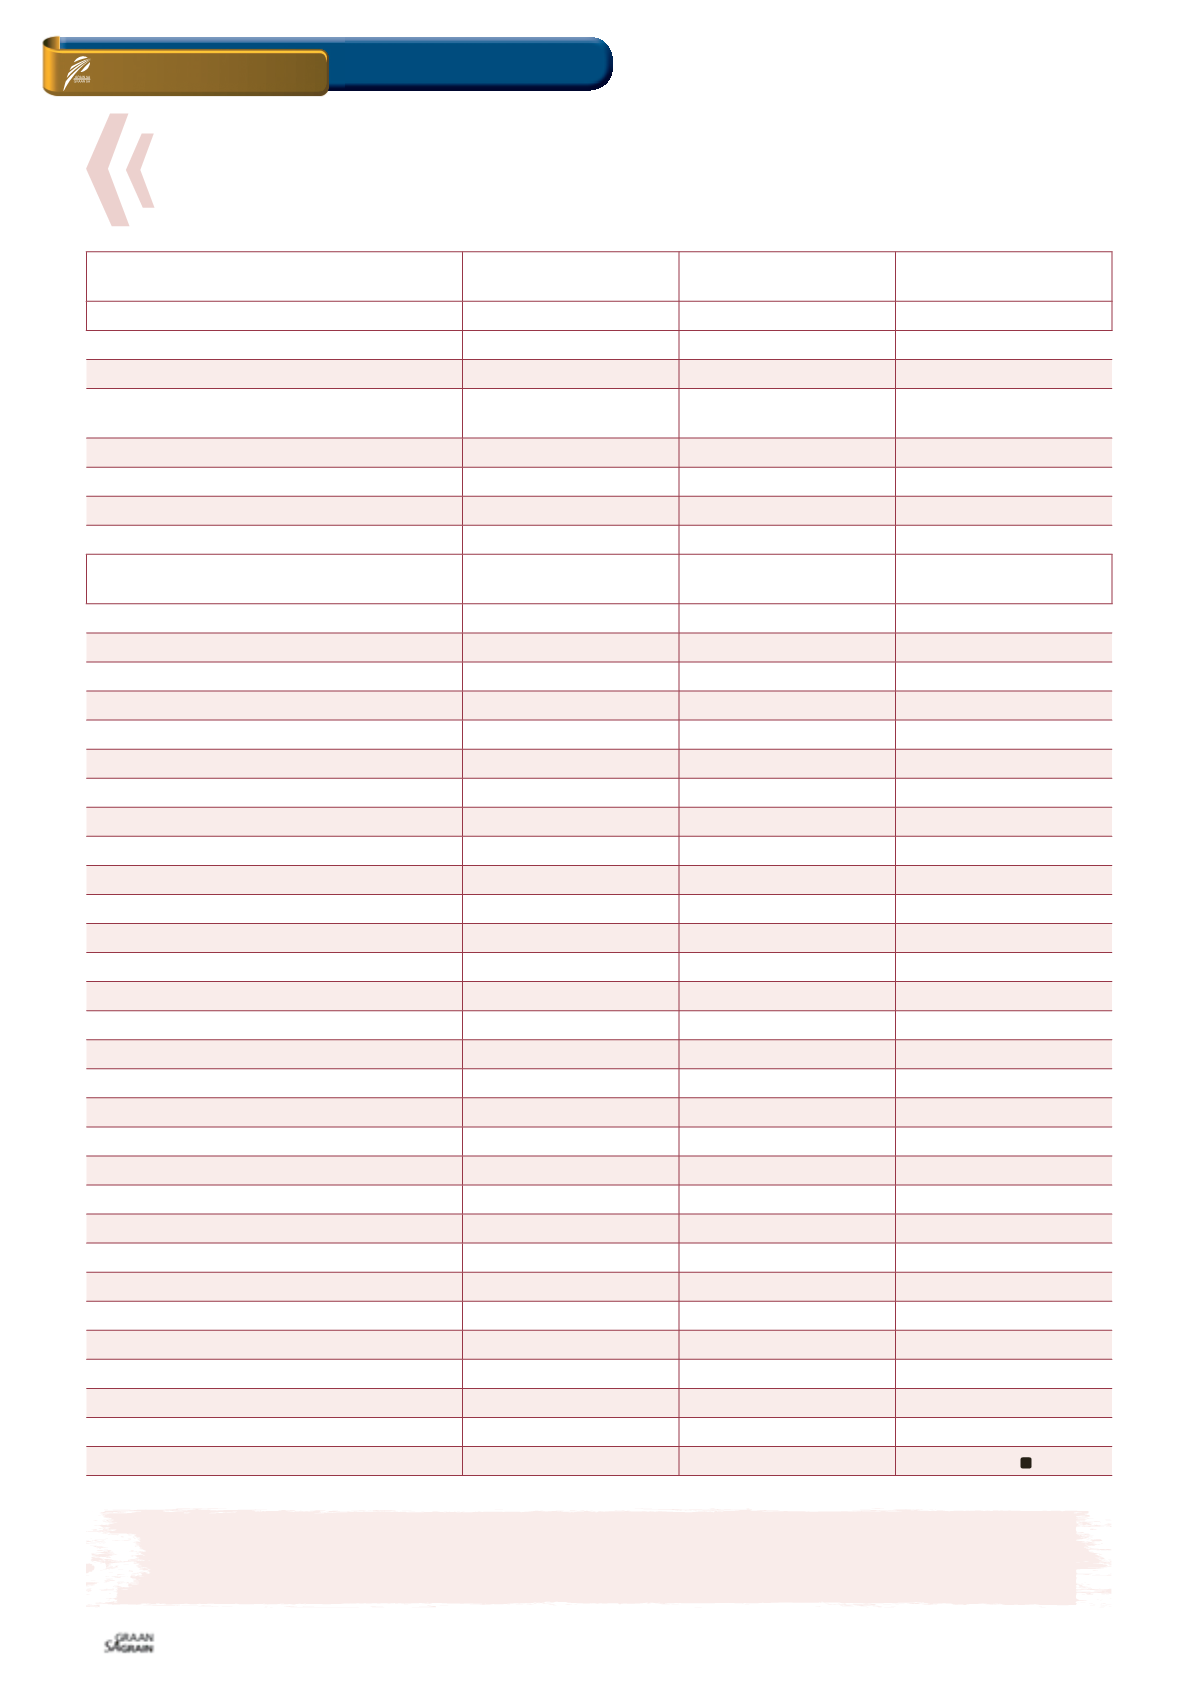
TABLE 2: SUPPLY AND DEMAND OF SOUTH AFRICAN WHEAT.
Source: Grain SA
ON FARM LEVEL
GRAIN MARKET OVERVIEW


