45
October 2013
Quality parameter
Argentina
Australia
Brazil
Canada
Germany
Romania
Russia
Ukraine
Uruguay
USA
RSA
WWF protein, % (12% mb)
11,3
11,4
11,2
13,3
11,1
12,3
11,1
10,7
10,2
11,2
11,8
Hlm, kg/hl
80,6
82,6
80,5
82,7
75,5
77,8
80,3
80,4
81,0
79,1
80,7
Screenings, %
2,52
1,98
2,75
2,36
1,27
3,36
4,40
1,90
1,75
2,90
1,56
Number of samples
89
31
22
3
1
4
8
5
4
9
433
Flour colour, KJ
-2,0
-2,9
-1,9
-2,8
-2,2
-1,5
-1,9
-2,2
-2,5
-1,9
-2,8
Wet gluten, % (14% mb)
25,2
27,5
25,2
36,7
25,7
28,8
24,6
22,9
22,6
24,5
28,7
Dry gluten, % (14% mb)
8,9
9,7
8,7
12,6
9,0
10,0
8,9
8,2
8,1
8,5
9,9
Farinogram
Water absorption,
% (14% mb)
59,2
61,0
60,1
67,4
50,1
60,0
57,7
58,4
58,3
54,3
61,3
Development time, min
2,2
3,9
1,8
5,0
1,7
3,5
1,9
1,7
1,7
1,8
4,1
Stability, min
7,1
10,5
3,6
8,9
4,7
8,6
2,7
2,7
1,9
6,9
8,5
Alveogram
Strength, cm
2
33,8
37,6
31,3
43,9
14,8
30,5
28,1
29,2
26,7
23,4
35,0
Stability, mm
97
106
99
111
34
96
96
89
100
59
82
Distensibility, mm
62
67
57
84
105
60
48
59
44
79
98
P/L
1,63
1,66
1,88
1,32
0,32
1,61
2,04
1,54
2,27
0,78
0,89
Extensogram
Strength, cm
2
93
103
80
87
74
72
96
79
75
81
90
Maximum height, BU
434
446
384
292
390
331
460
369
391
376
340
Extensibility, mm
155
166
151
212
131
154
142
157
139
145
188
Mixogram
Peak time, min
4,4
3,5
4,0
2,4
3,8
3,5
5,2
4,2
4,0
4,1
3,0
100 g baking test
Volume, cm
3
704
805
698
907
740
716
798
755
740
747
852
Evaluation
4
1
4
2
1
5
0
1
0
1
0
Number of samples
89
31
22
3
1
4
8
5
4
9
90
WWF = whole wheat flour
TABLE 1: AVERAGE QUALITY DATA OF IMPORTED WHEAT DURING THE 2011/2012 SEASON.
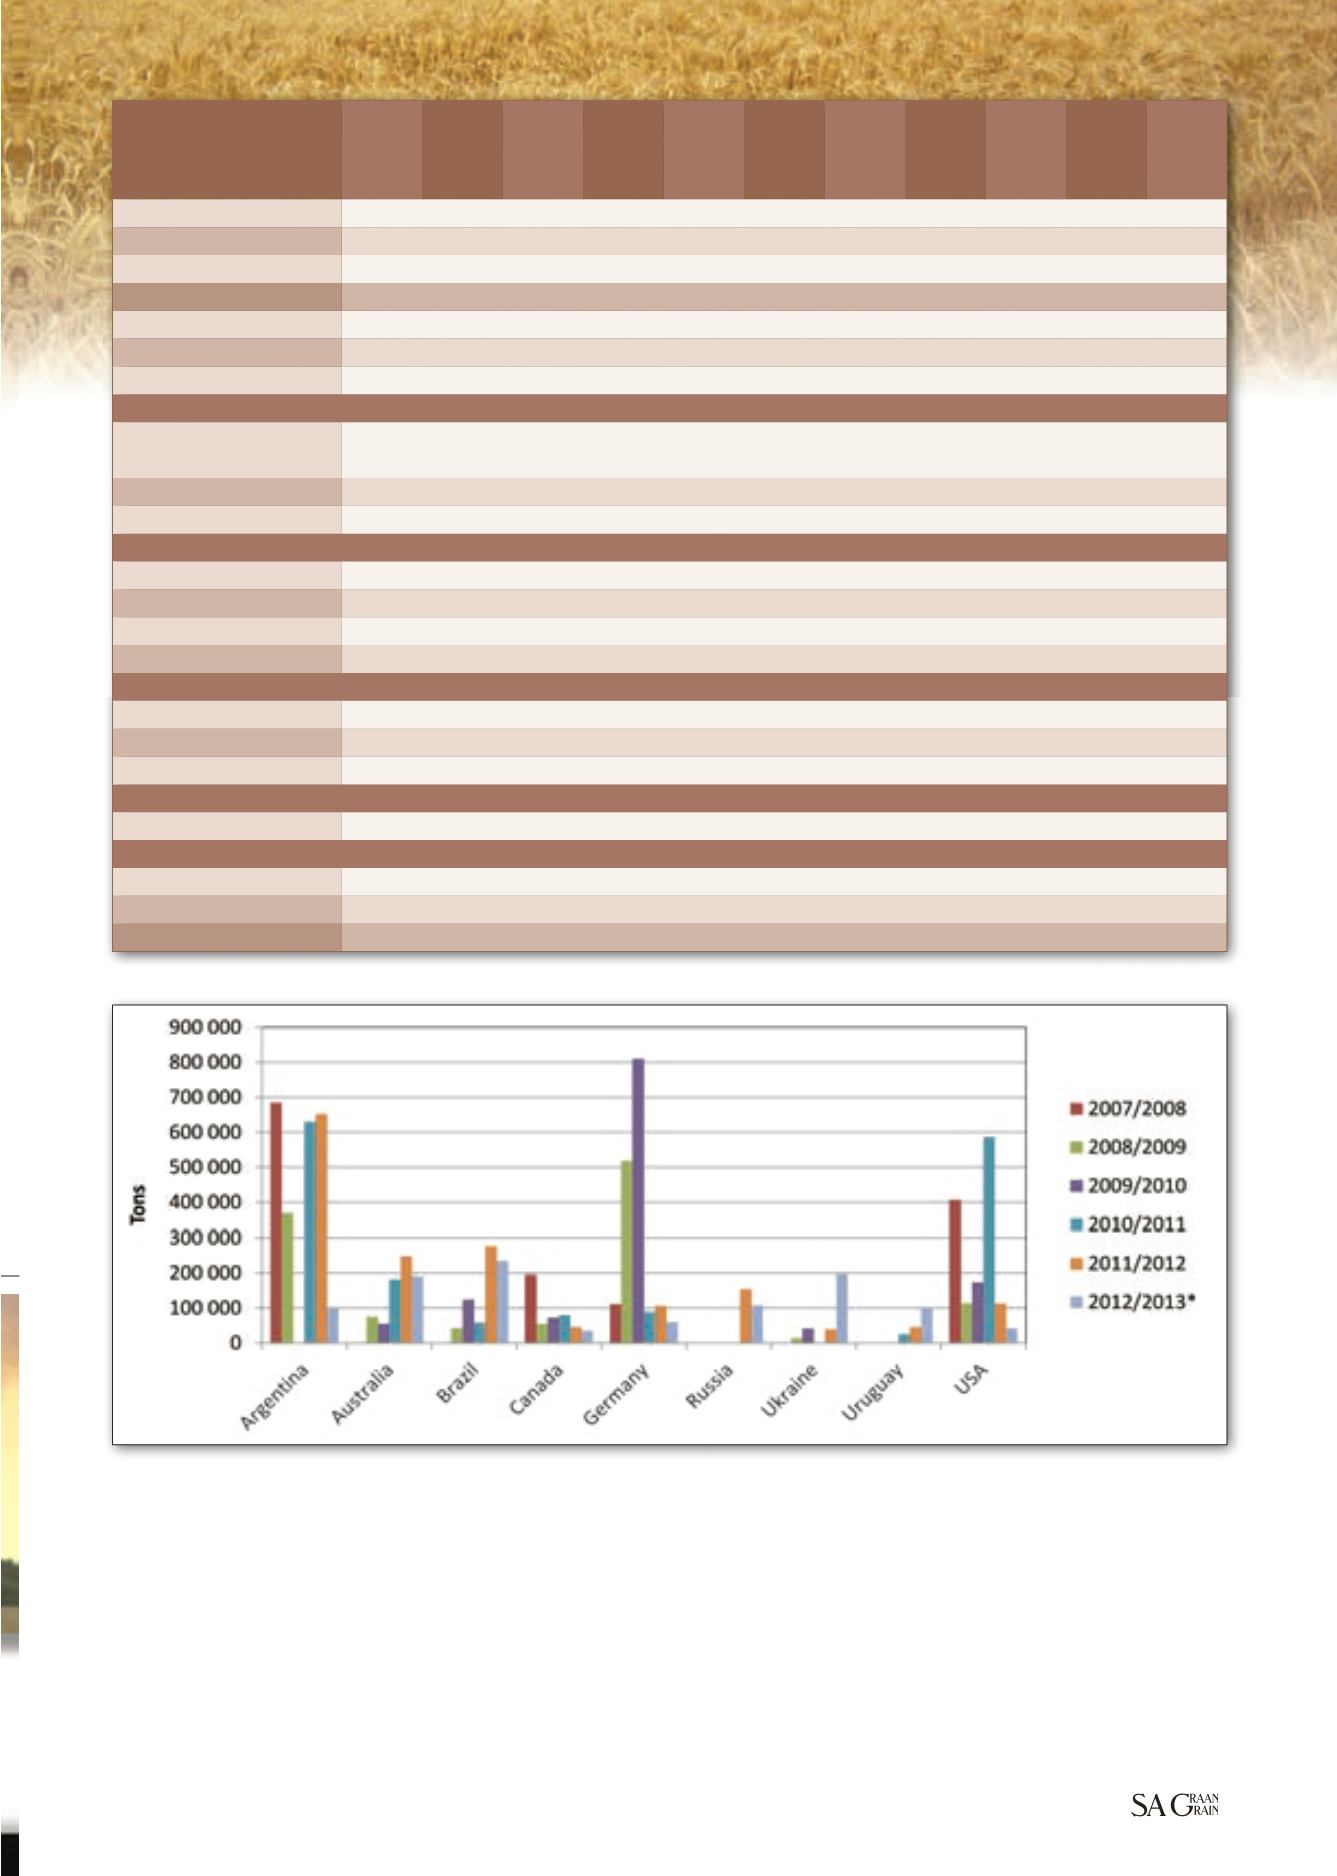
Graph 1: Total imports per country per season over the previous five seasons as well as the current season.
* 2012/2013 season figure includes imports for up until 23 August 2013
Please note that countries from which a total of less than 100 000 tons of wheat have been imported have not been included in the graph.
Continued on page 46
SA Graan/Sasol Nitro
photo competition
– Stefné Muller 2012
It is important to remember that higher protein content does not
necessarily equate to better quality. The farinogram development times
as well as the stabilities of most of the imported wheat (Australia, Canada
and Romania excluded) were much shorter than the South African wheat.
Russia, Ukraine and Uruguay showed extremely poor quality on the
farinogram, followed by Germany, Brazil, USA and Argentina.
Protein quality determines the alveogram strength, and the Canadian,
Australian and South African wheat had the highest strength values,
followed by Argentina. The imported wheat samples tended to have
short distensibility values on the alveogram which can result in lower loaf
volumes. The short distensibility values also resulted in high P/L values
of more than 1,50. The P/L ratio is obtained by dividing the stability value
(P) with the distensibility value (L). Again as in previous seasons, the
imported wheat samples, except for Canada, showed a tendency towards
longer mixogram mixing times. Australian and Romanian wheat lies on
the upper limit of what is considered acceptable mixing times (2,8 to
3,5 minutes) in South Africa.


