109
March 2014
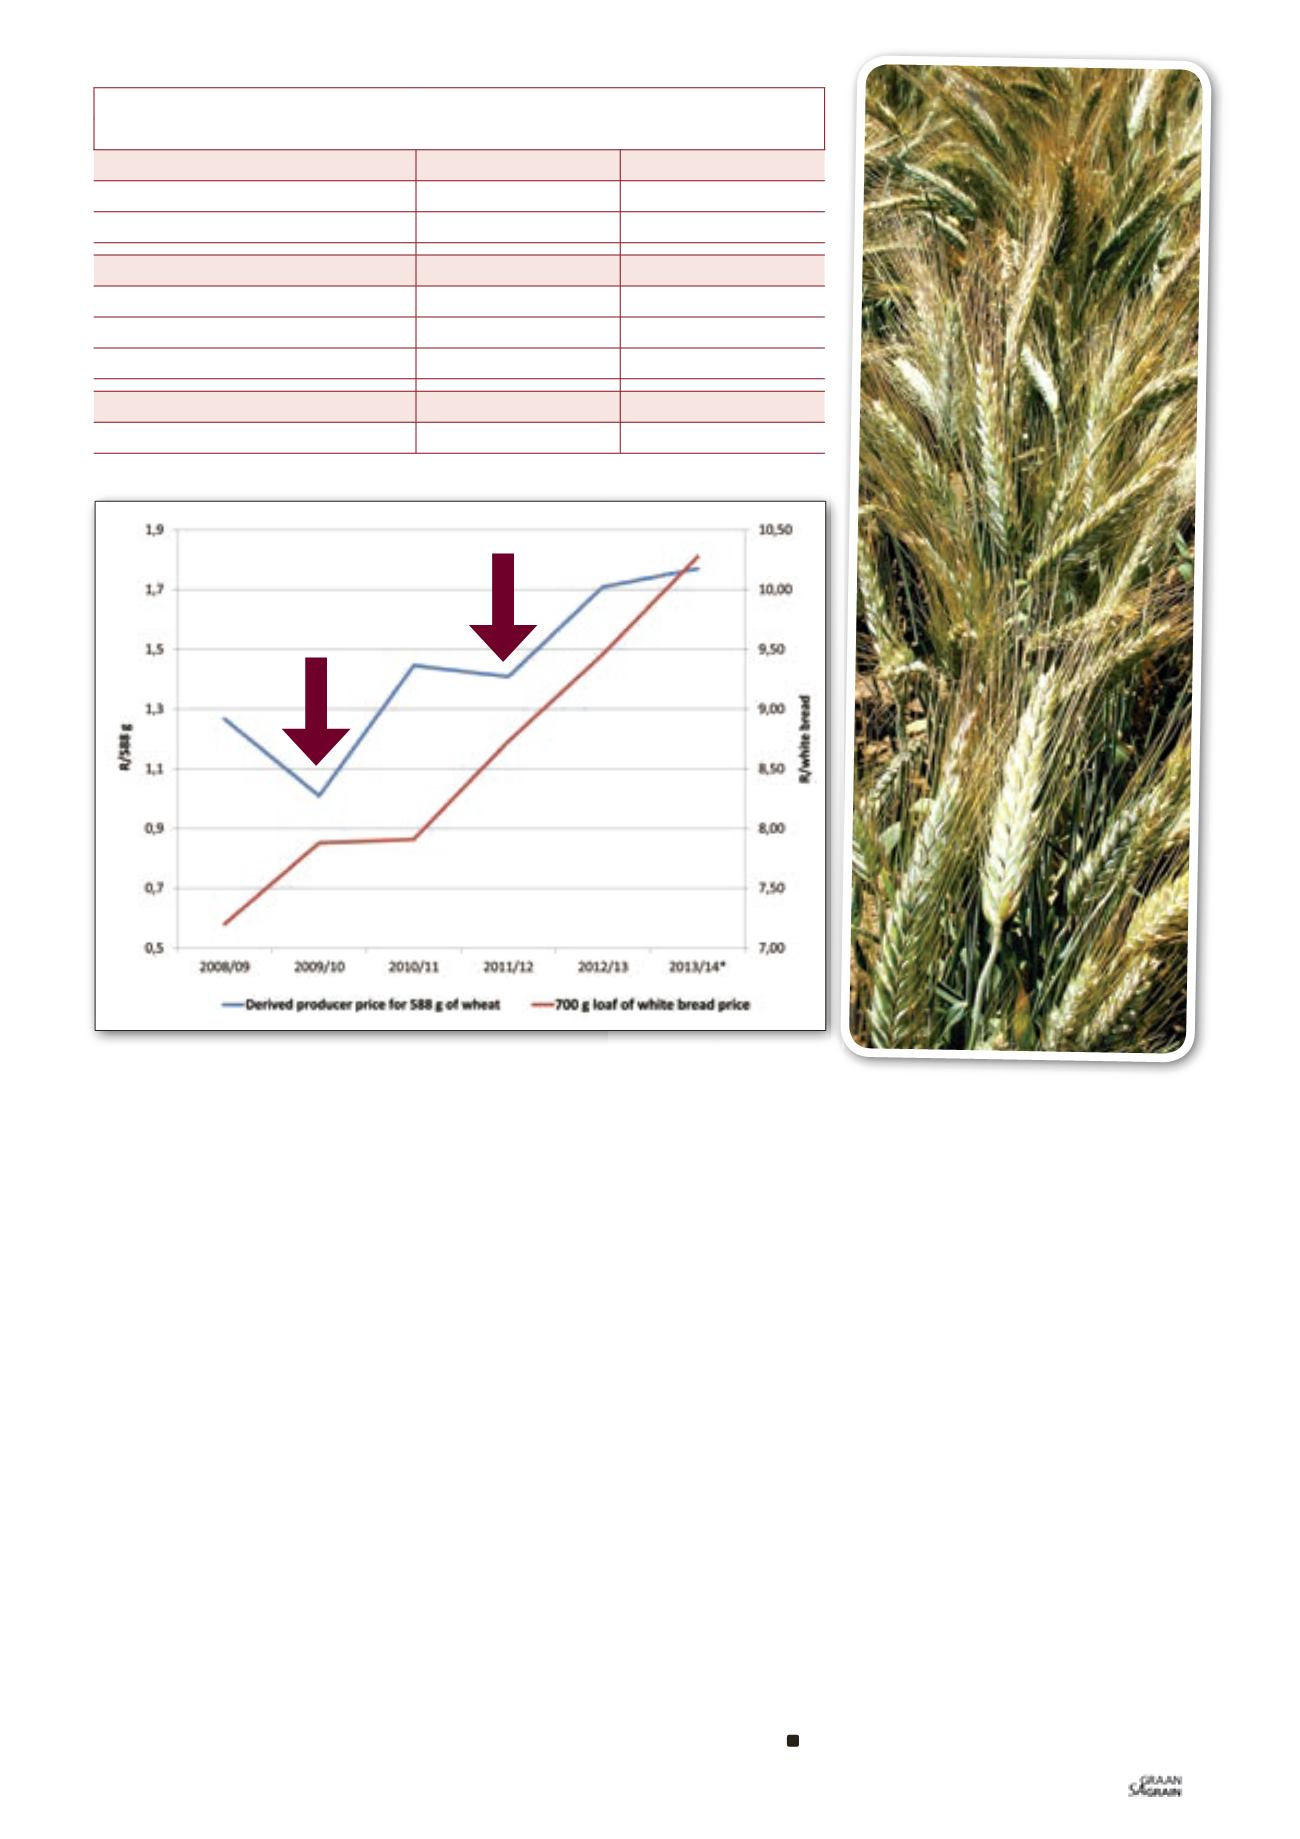
shows the widening gap between wheat and bread prices, and that
producer price increases were in many cases not responsible for the
increase in the bread price to consumers.
Wheat producer’s percentage share of
retail white bread price
While input prices increased both for producers and retailers, the
producer’s share of the consumer’s rand remained stationary or
decreased. Between 2008 and 2013, a wheat producer’s share of
a 700 g loaf of white bread fluctuated between 13% and 18%.
Figure 2
clearly shows a wheat producer’s percentage share of a
retail white bread price (2013).
This indicates that when a consumer bought a loaf of white bread,
the raw material (wheat) simply costs R1,77 in comparison to the
total bread loaf price of R10,28. For example, if the loaf consists
out of 21 slices, the producer’s cost for that bread is only 3,5 slices,
while the rest of the wheat-to-bread value chain is responsible for
the additional cost.
Costs involved in producing 588 g of wheat
Costs at primary level (i.e. at the level of wheat production) have
increased continually due to increases in input costs. This places
pressure on producers’ profitability and hence the ability to bring
additional hectares into production. Wheat producers are price
takers, and in a competitive market, they cannot simply pass their
higher costs on to consumers. To date, rising costs have largely been
absorbed by producers, often with significant financial loss.
Table 1
shows the gross income, total cost and net income of
a Western Cape wheat producer in order to have produced 588 g
(700 g loaf of white bread) of wheat during 2011 and 2012. Actual
production cost figures were used for calculation purposes.
Over the two year period, the gross income producers received for
the 588 g, increased with 30 cents from R1,41 in 2011 to R1,71 in
2012, while the total costs (variable and fixed cost) to produce that
same 588 g, increased with 22 cents from R1,34 to R1,56 over the
same time period.
The net farming income increased from 2011 to 2012; from making a
7 cent profit in 2011 to making a 15 cent profit in 2012.
Conclusion
Consumers must be sensitised on the pricing of bread and that the
increase is not necessarily linked to the producer, but more to the
other role-players within the wheat-to-bread value chain.
It is of concern to note the stationary or decreasing share producers
get out of the consumer rand and that a wheat producer’s share of a
700 g loaf of white bread fluctuated only between 13% and 18% in
the last six years. In some cases the wheat producer even subsidised
the consumer.
PRODUCTION COST (2013 PRODUCTION SEASON)
2011
2012
GROSS INCOME
B2 derived producer price (R/ton)
R2 395
R2 907
Gross income (R/588 g)
R1,41
R1,71
COSTS (R/588 g)
Variable cost
R1,09
R1,28
Fixed cost
R0,25
R0,29
Total cost
R1,34
R1,56
NET INCOME
Nett profit (588 g of wheat)
R0,07
R0,15
TABLE 1: NET INCOME/LOSS TO PRODUCE 588 G OF WHEAT (700 G LOAF OF WHITE BREAD).
Graph 1: Derived producer price of wheat (588 g) versus the price of a 700 g loaf of white bread.
SA Grain/
Sasol Nitro photo competition


