


 53 / 76

“down under”?
– measuring and comparing the competitiveness of
the South African wheat industry with Australia
C
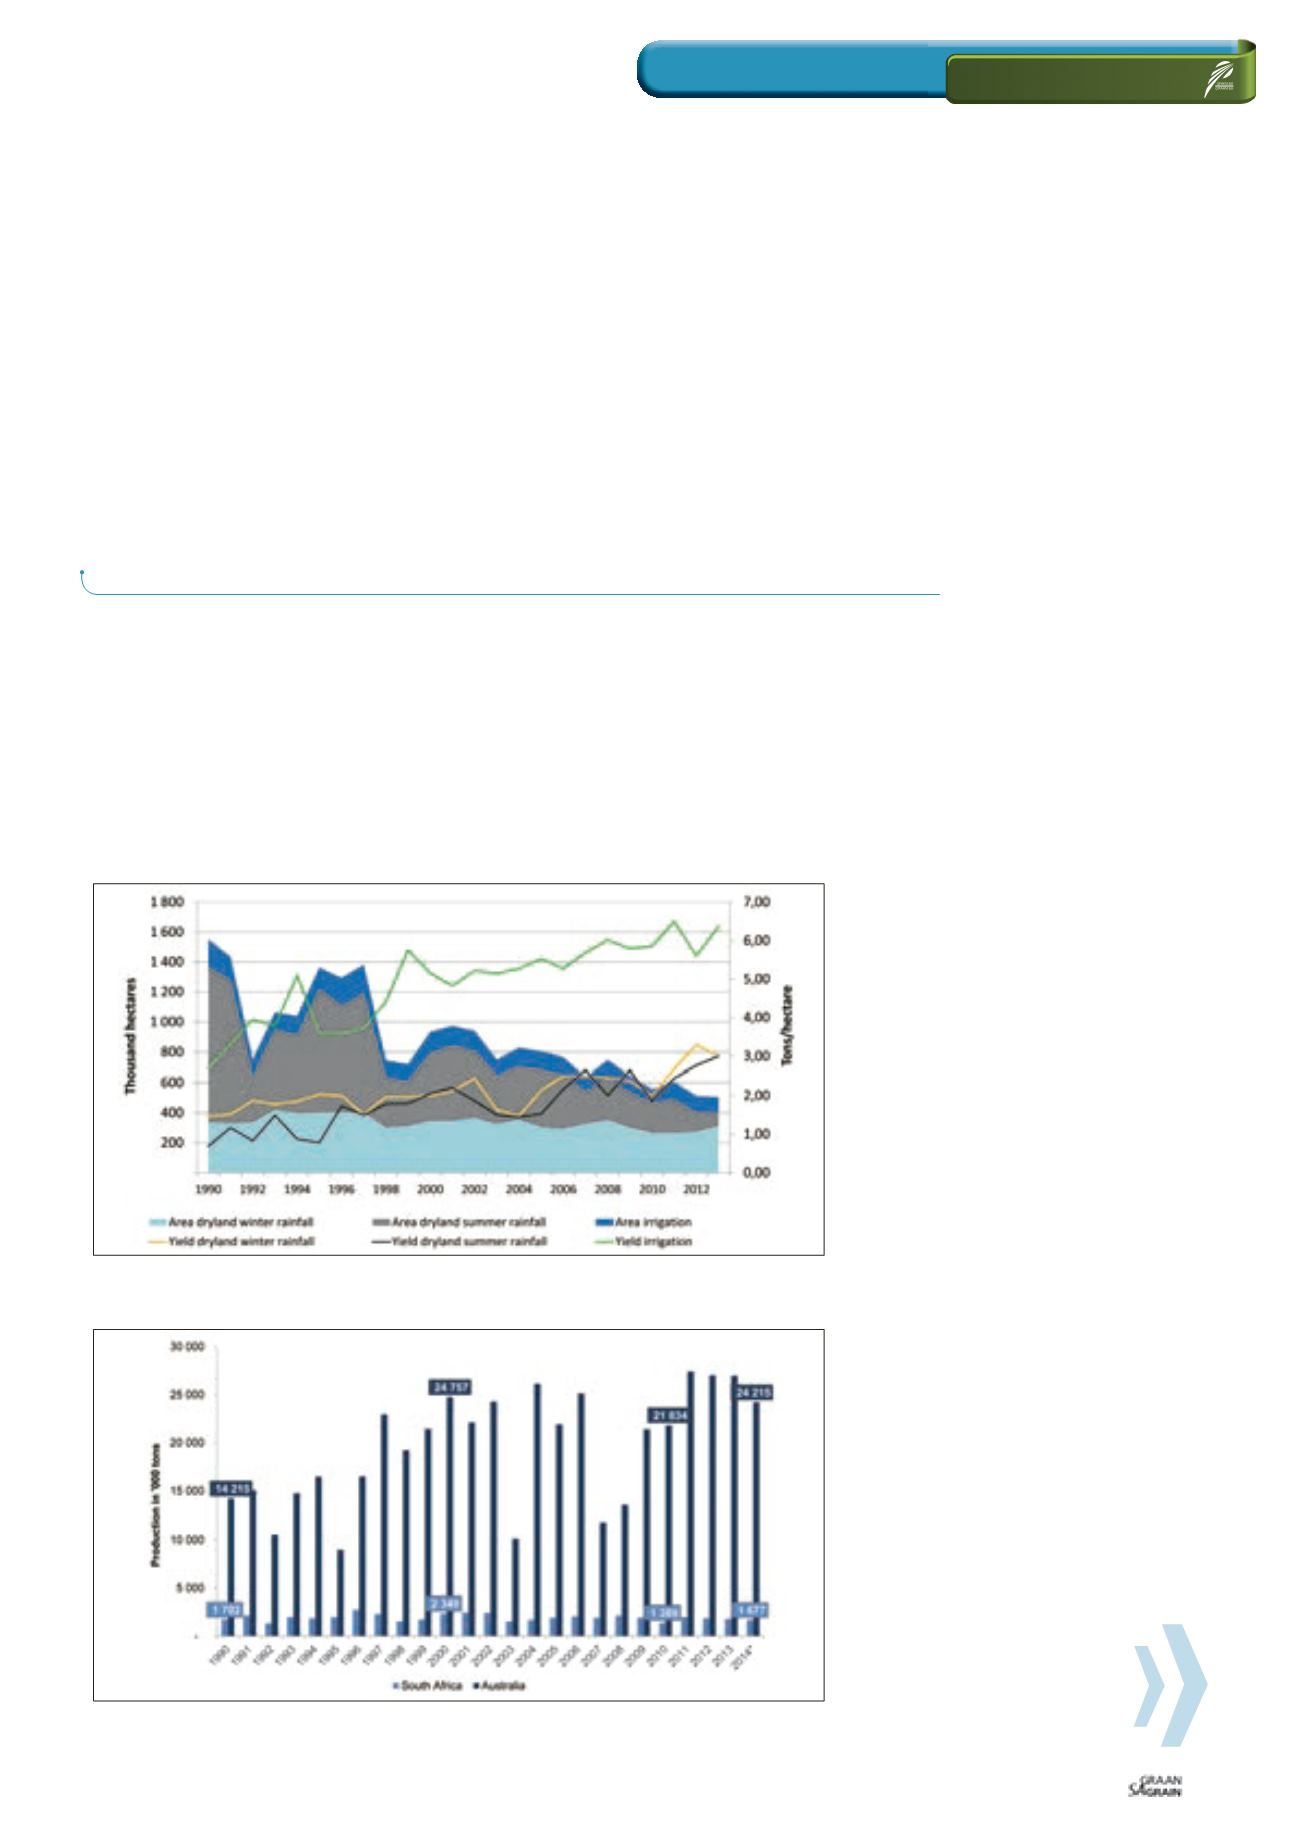
oncern has been shown about the persistent decline of
areas sown to wheat in South Africa. In 1982, South Africa
cultivated more than two million hectares of wheat and
have ever since declined to 482 000 hectares in 2014 with
the majority of the area lost in the summer rainfall region, or more
specifically, the Eastern Free State (
Graph 1
).
A number of drivers have influenced this reduction over the past
three decades where profitability, production risk and more
favourable alternative crops were the main contributors.
Technology in maize and more recently, soybean seed varieties
led to a steeper increase in yield levels which favour these
summer crops above wheat production. Currently, the question
is being asked whether climate change has influenced traditional
precipitation during key growth stages of wheat in the Eastern
Free State, forcing yield and yield growth trends downwards.
Furthermore, the adoption of conservation and rotational farm
practise in the Western and Southern Cape, led to a consolidation
of hectares between wheat, barley, canola and pasture crops.
Graph 1 illustrates the loss in area over
the past two decades and in particular, the
summer rainfall region. The graph further
illustrates the yield trend for dryland and
irrigated wheat.
In this article, a comparison is made be-
tween South African and Australian wheat
industries in order to measure and bench
mark the relative competitiveness of the
South African wheat industry with a large
global player such as Australia.
Industry overview: South
Africa and Australia
In the following graphs, comparisons are
made between South Africa and Australia
for total production, yield per hectare and
US$ value per ton for the period from 1990
to 2014. It is projected that Australia will
produce more than 24 million tons of wheat
in 2014 under approximately 13,83 million
hectares compared to 1,68 million tons
of wheat in South Africa under 482 000
hectares (
Graph 2
). Area under wheat
production has increased from 9 million
hectares in 1990 to 13,83 million in 2014.
Graph 3
illustrates the dryland wheat
yield trends from 1990 to 2014. As can be
observed from the graph, South African
(winter rainfall region) yield levels have
tracked those of Australia until 2000.
Towards 2014, wheat yields in South Africa
had outperformed the average obtained by
Australian producers. The average yield
obtained in Australia in 2013 was 2 tons
per hectare compared to South Africa’s
2,92 tons per hectare (winter rainfall region).
51
February 2015
RELEVANT
DIVAN VAN DER WESTHUIZEN
and
LINDSAY TRAPNELL,
The Bureau for Food and Agricultural Policy (BFAP);
Acknowledgement:
ASHLEY HERBERT,
Agrarian management, Perth
Graph 1: Areas of production for wheat and yields per hectare for dryland and irrigated regions of
South Africa.
Graph 2: Wheat production in South Africa and Australia (1990 to 2014).
Source: BFAP, 2014 and Australian Bureau of Census and Statistics, 2013