


 55 / 76

53
February 2015
RELEVANT
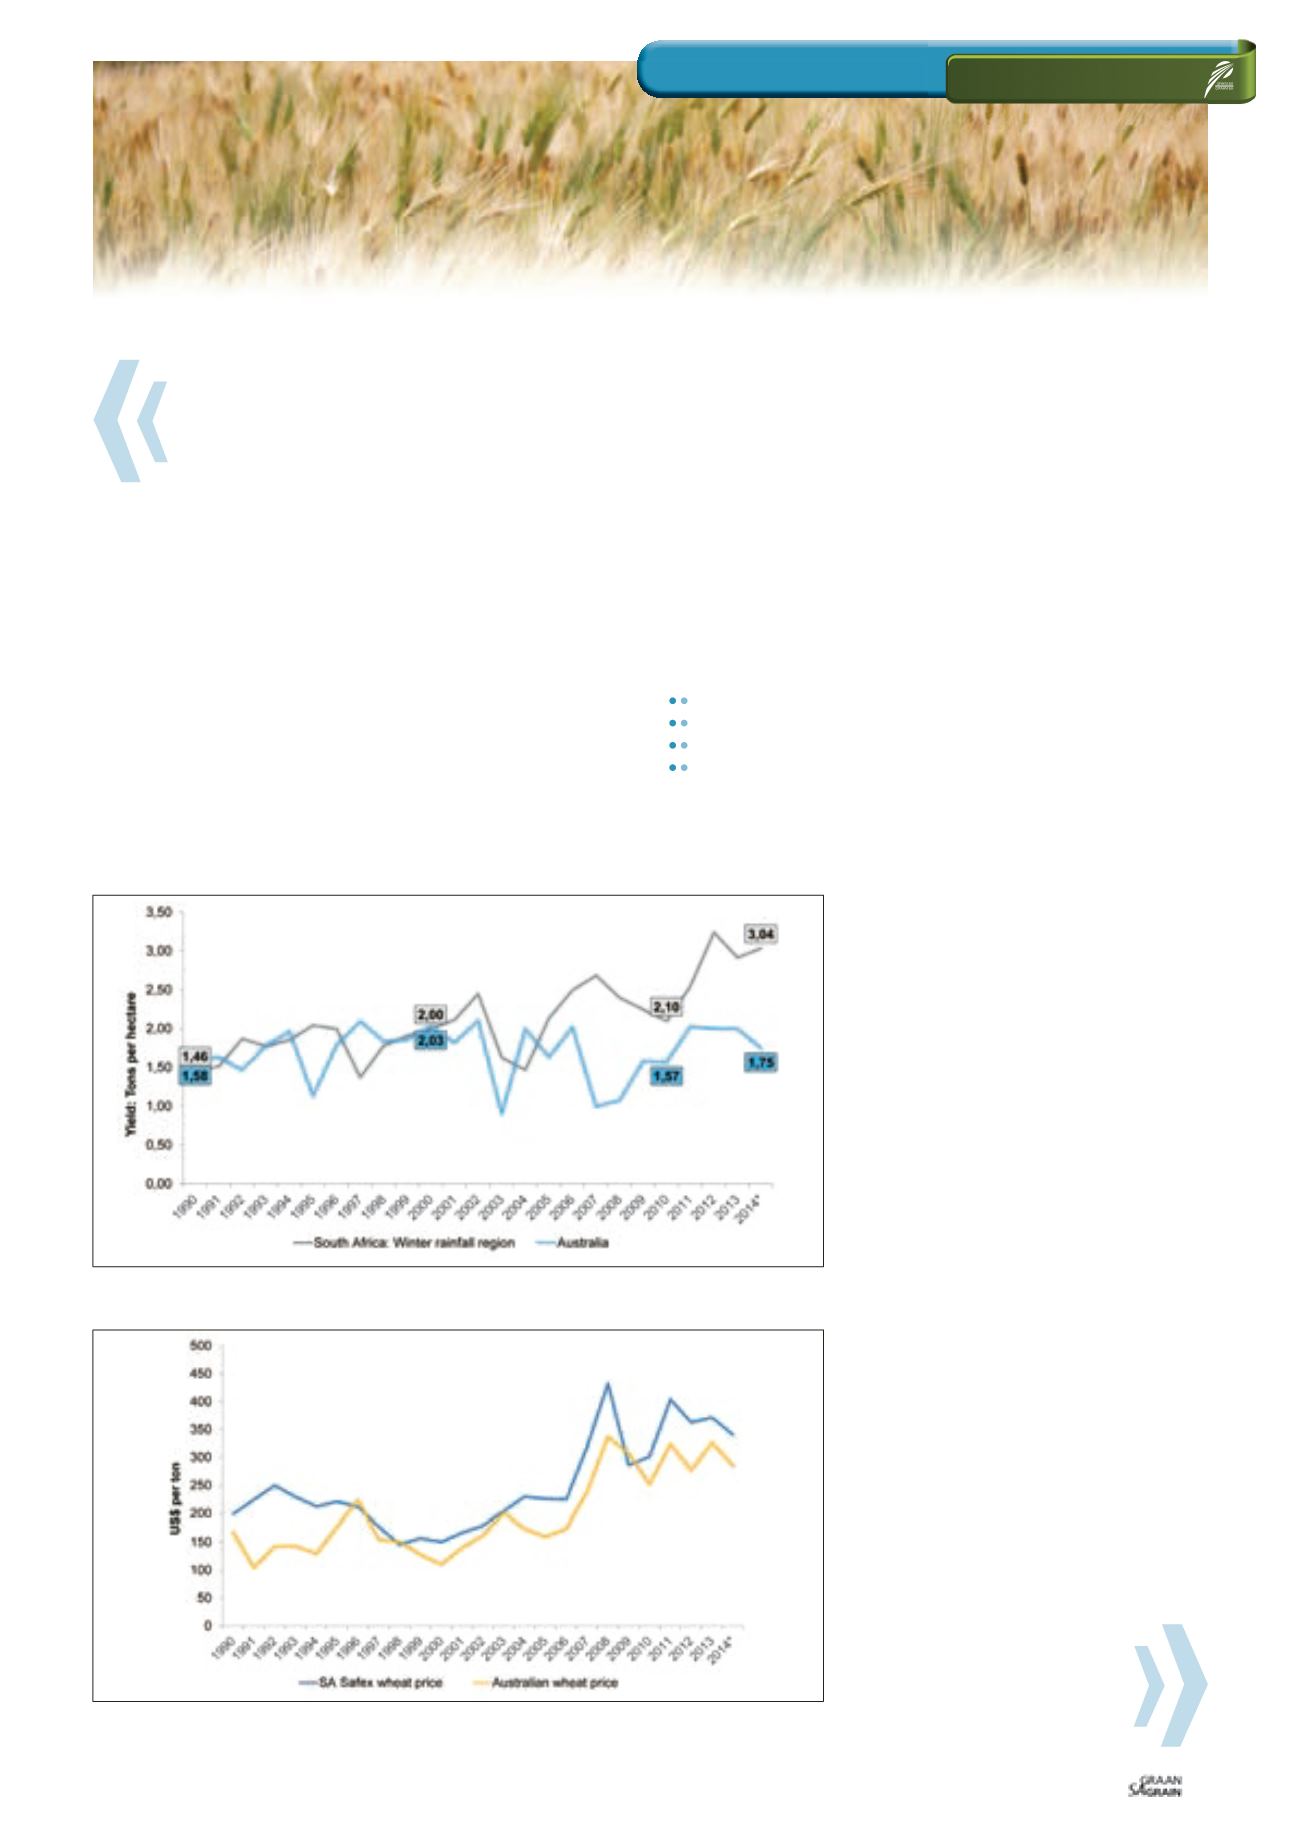
The price in US$ per ton for South African wheat is greater than
for wheat grown in Australia (
Graph 4
). The reason is that South
Africa is a net importer of wheat; whereas Australia is a net
exporter. The average wheat price in 2013 in Australia was
US$326 per ton. In the same year, South Africa obtained an average
Safex price of US$372 per ton.
In the following section it is revealed that the gross margin per
hectare for wheat grown in South Africa is higher than that of
wheat grown in Australia. This is mainly because gross income for
South African wheat attracts an import price that is higher than the
export price for Australian wheat. The variable costs of production
for South African and Australian grown wheat are very similar.
Farm-level comparisons: Measuring
results from agri benchmark
Agri benchmark is an international network of agricultural experts,
advisors, producers and agri businesses aiming to understand
production systems, benchmark costs and who measures farm
practises across the globe.
More than 30 countries currently form part of the network in order
to compare and benchmark farms globally from both a financial
and technical perspective. In the following section a comparison
is made between wheat farms in Australia’s wheat belt and
South Africa’s Overberg, Eastern Free State and Northern Cape
irrigation producing regions.
Graph 5
illustrates the yield obtained on a typical farm in Austra-
lia’s western wheat belt and South Coast wheat belt producing
regions compared to levels in the Overberg, Eastern Free State and
Northern Cape irrigation regions.
The graph further shows the establishment cost per hectare for
the two countries which include the cost for seed, fertiliser, plant
protection and operating costs. The results refer to the following
period:
Australia: Average for 2009 - 2013
South Africa – Eastern Free State: Average for 2012 - 2013
South Africa – Overberg: Average for 2008 - 2012
South Africa – Northern Cape: Average for 2008 - 2012
Graph 5 demonstrates that from a yield perspective, South Africa
performed well against Australian farms where the Overberg region
had outperformed both Australian typical farms.
The Eastern Free State farm with an
average yield of 2,33 tons per hectare had
outperformed the Australian wheat belt
farm, but not the South Coast farm that
is situated in a high rainfall region and is
more representative of a typical western
Australian farm.
In terms of cost structures, South Africa’s
establishment cost in both the Eastern
Free State and Overberg was higher when
compared to Australia’s US$199 per hec-
tare in the western wheat belt and US$261
per hectare in the South Coast wheat belt.
In particular, contractor and diesel costs on
South African farms were higher.
Graph 6
represents the key technical
parameters between the two countries and
illustrates fertiliser and seed application
rates along with nitrogen technical and
economic productivity indicators.
The farms in the Eastern Free State and
Overberg regions applied on average
between 47 to 51 kilograms of nitrogen
per hectare, whereas Australian farms
varied between 32 kilograms per hectare
in Western Australia and 58 kilograms
per hectare in the South Coast wheat belt
region. Seed application rates in the South
Coast region of Australia substantially
exceeded South African farms.
On average, the South Coast farm applied
80 kilograms of seed per hectare. From a
technical productivity perspective, South
African dryland farms performed similar to
Australian farms.
Graph 3: Dryland yields of wheat for South Africa (winter rainfall) and Australia (1990 to 2014).
Source: BFAP, 2014 and Australian Bureau of Census and Statistics, 2013
Graph 4: Price of wheat in US$ per ton for South Africa and Australia (1990 to 2014).
Source: BFAP, 2014 and Australian Bureau of Census and Statistics, 2013
How do we compare with “down under”?
SA Grain/
Sasol Chemicals (Fertiliser) photo competition