


 56 / 76

Februarie 2015
54
RELEVANT
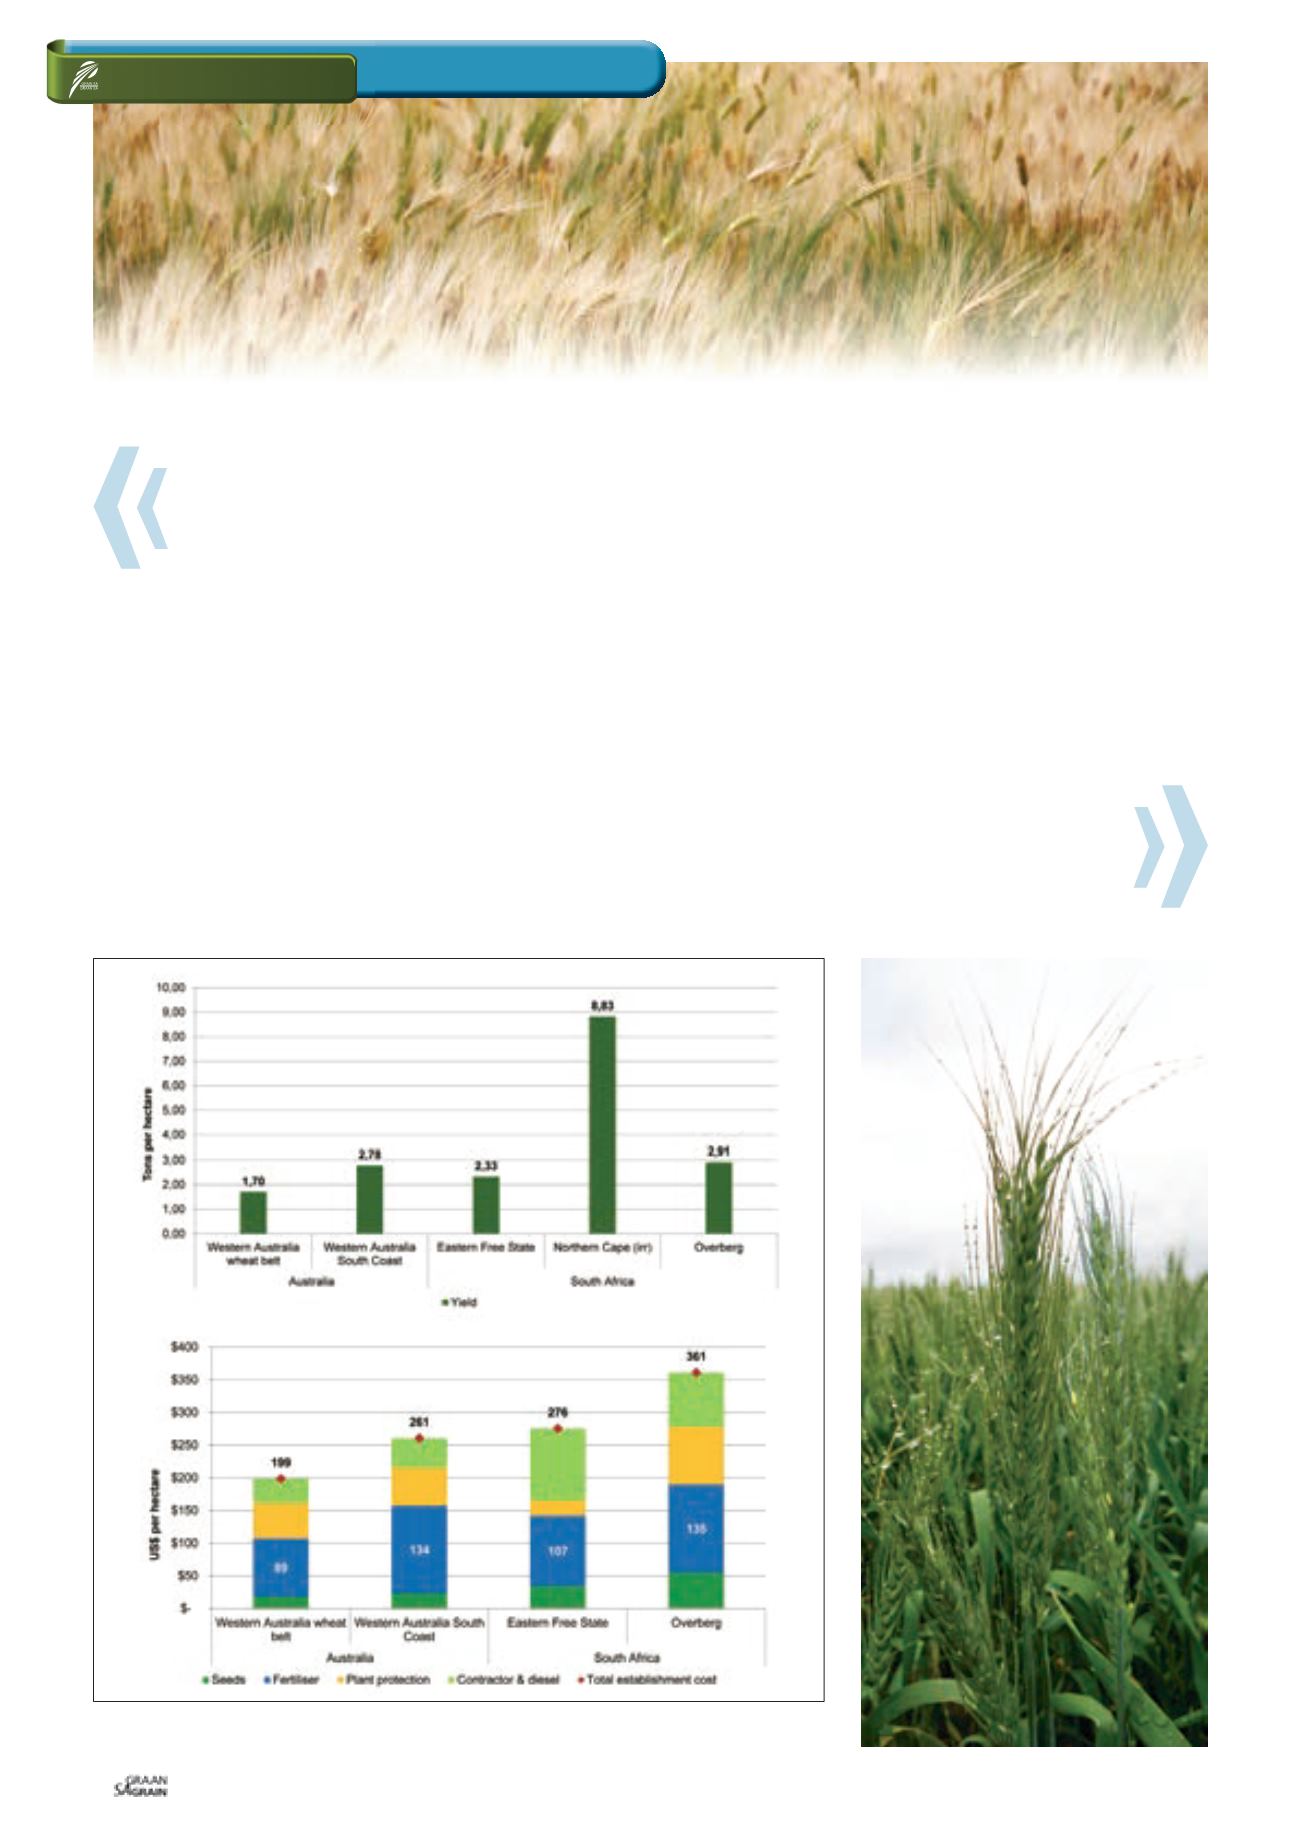
Graph 5: Yield in tons per hectare and establishment cost in US$ per hectare.
Source: BFAP, 2014 and agri benchmark, 2014
In the Overberg region, for every kilogram of nitrogen being
applied, a total of 57 kilograms of wheat was harvested compared
to 53 kilograms in Western Australia and 48 kilograms in the South
Coast region. Furthermore, for every US$ spend on nitrogen on
Australian farms, a total of US$9 was obtained in revenue (wheat
sold). In South Africa this indicator varied between US$8 on irriga-
tion farms to US$13 in the Eastern Free State.
Graph 7
illustrates the relative competitiveness of production costs
in South Africa and Australia on a per ton basis which illustrates
the establishment costs to produce one ton of wheat.
Yield is therefore integrated in the comparison. In a global envi-
ronment, it is essential to know who can produce a crop the most
cost effectively and efficiently. The second graph illustrates the
gross margin levels on a per ton basis, where the red bars show the
establishment cost and the blue bars, the gross margin per ton.
From Graph 7 it is evident that South African farms can compete
against Australian farms as seen from a cost perspective. On
average, it will cost an Eastern Free State or Overberg producer
about US$125 to produce one ton of wheat where in the South
Coast it will cost a producer US$98 per ton. The lower yield levels
on the Western Australian wheat belt farm caused the per ton cost
to increase significantly.
Furthermore, South African gross margin levels have exceeded
Australian wheat farms, driven by higher output prices due to
the import parity status of South African wheat. On average,
gross margin levels in South Africa varied between US$198 in
the Eastern Free State to US$170 in the Northern Cape irrigation
region and the Overberg.
Although wheat grown in South Africa enjoys a higher gross
margin than that produced in Australia, the extra benefit is not large
enough to offset the large comparative advantage that Austra-
lian producers receive in having huge economies in size of produc-
tion compared with those of South African wheat producers.
In Australia, according to the Australian Bureau of Agricultural
and Resource Economics (ABARE), in 2011 the average area of
wheat per producer grown by 29,786 Australian producers, was
453 hectares.
How do we compare with “down under”?
SA Grain/
Sasol Chemicals (Fertiliser) photo competition
– Dirkie Neethling 2011
SA Grain/
Sasol Chemicals (Fertiliser) photo competition