


 59 / 76

GUIDANCE. SIMPLIFIED.
MEET MATRIX
®
430
GPS guidance is no longer
too complicated or too costly.
With the Matrix 430 system, you’ll be in
WKH ¿HOG LQ D PDWWHU RI PLQXWHV ± QRW KRXUV
± HQMR\LQJ LPSURYHG SURGXFWLYLW\ $QG \RX¶OO
TXLFNO\ UHFRXS \RXU PRGHVW LQYHVWPHQW
LQ WKH V\VWHP E\ FRYHULQJ PRUH JURXQG
LQ OHVV WLPH ZKLOH UHGXFLQJ LQSXW FRVWV
Key features:
%ULJKW FRPSDFW JUDSKLFDO LQWHUIDFH
(DV\ FUHDWLRQ RI ¿HOG ERXQGDULHV DQG
UHFRUGLQJ RI DSSOLHG DUHDV
,QWHJUDO *166 UHFHLYHU VXSSRUWV *36 DQG
*/21$66 VLJQDOV IRU PD[LPXP SHUIRUPDQFH
$XGLEOH DOHUW ZDUQV RSHUDWRU ZKHQ HQWHUHG
LQWR DSSOLHG DUHDV
Learn more at
www.teejet.comFor example, in 2011, Australian producers had a comparative
advantage over South African producers.
In that year, each Australian wheat producer grew twice as
much or a 100% greater volume of wheat than that produced by
each South African producer. This comparative advantage has
continued to the present. It has led to them being more profitable
because on average, each grower was able to spread their over-
head costs over a much larger tonnage of output.
References
Australian Bureau of Agriculture and Resources (2011). Farm sizes and number of
wheat producers in Australia; Government of Australia, Canberra, Australia.
Australian Bureau of Agriculture and Resources and Sciences (2014). Agricultural
commodities; Australian Government Department of Agriculture, Canberra,
Australia.
Department of Agriculture, Forestry and Fisheries (2012). Wheat market value chain
profile; Pretoria, South Africa.
Department of Agriculture, Forestry and Fisheries (2013). Trends in the agricultural
sector; Pretoria, South Africa.
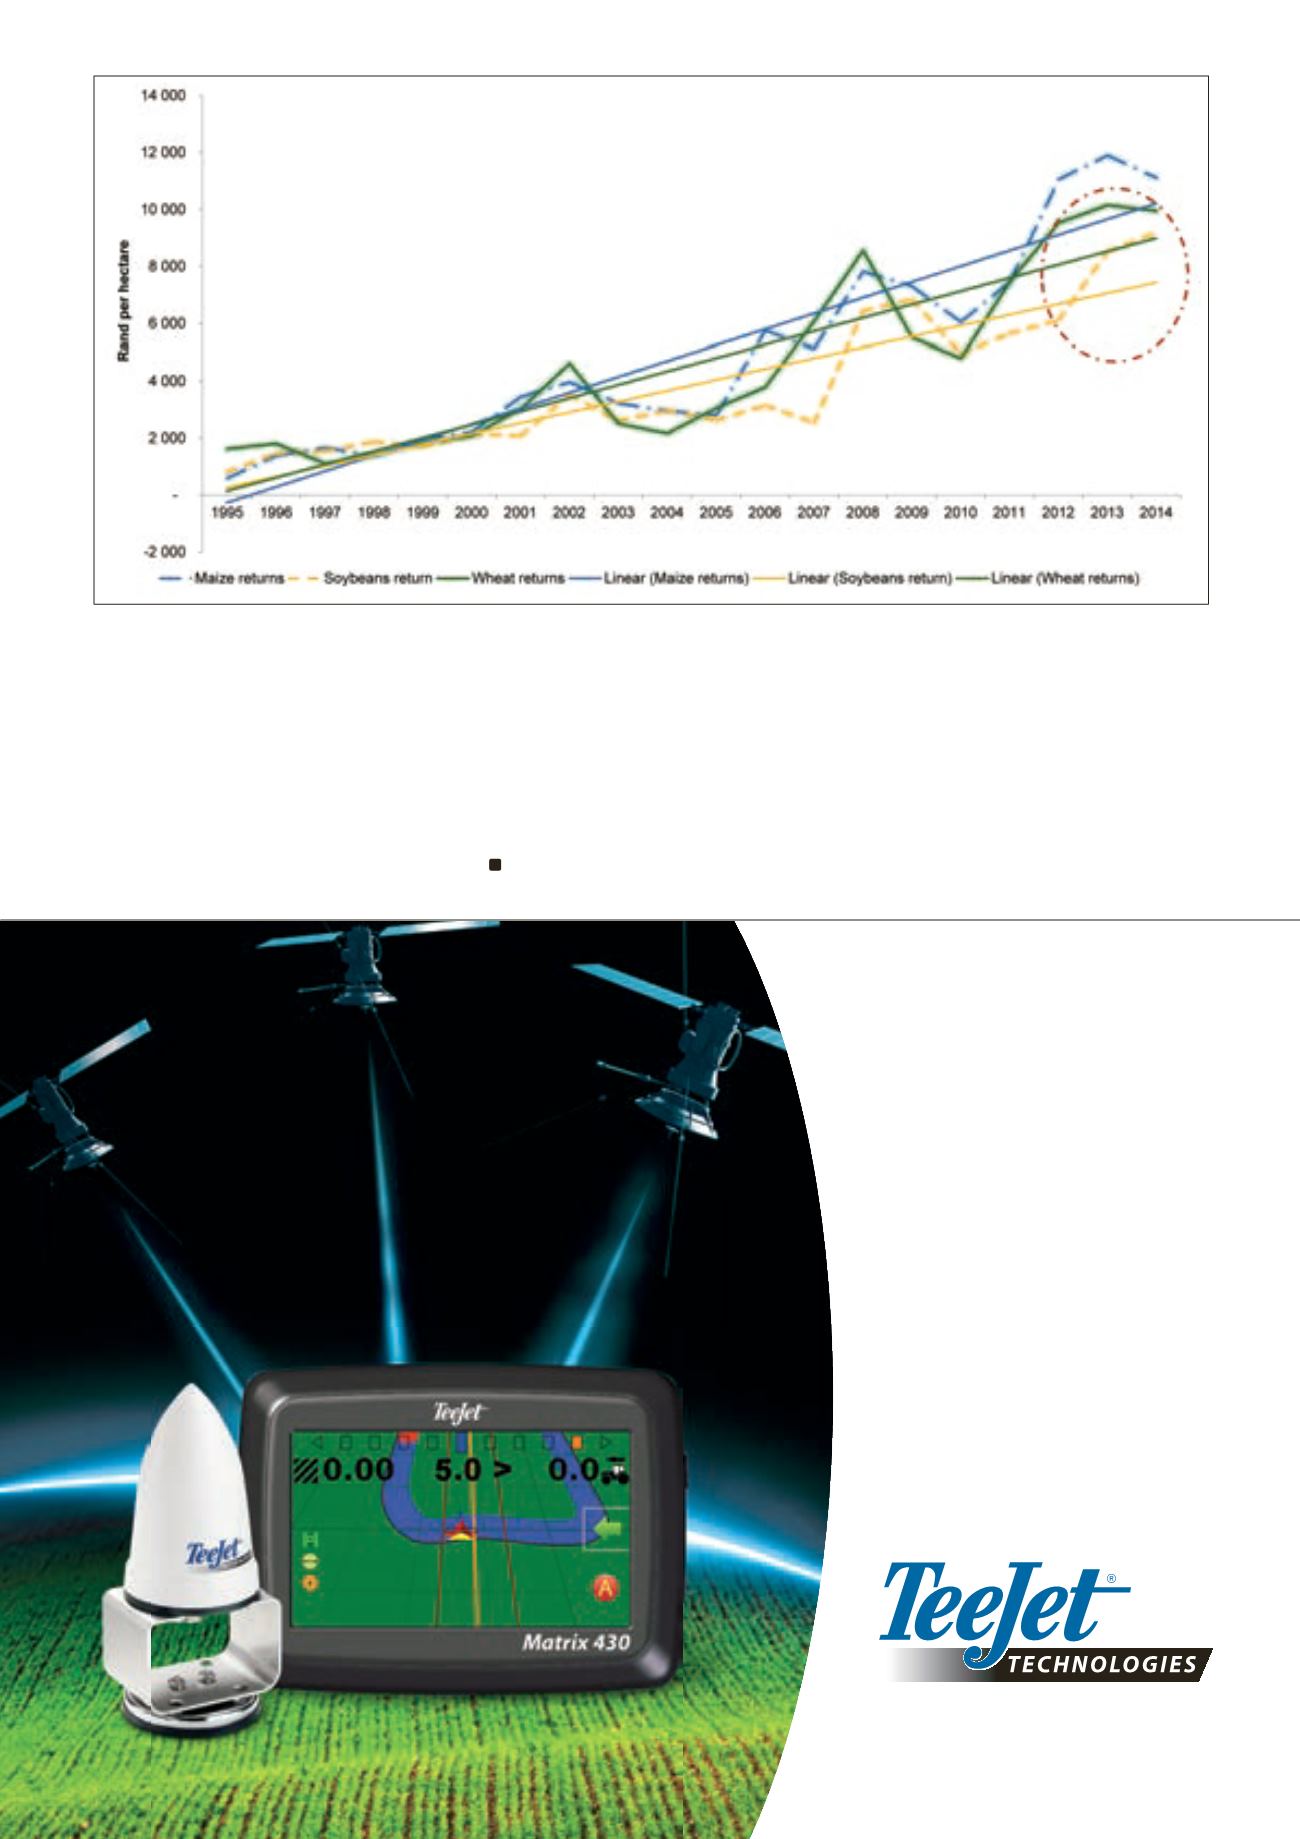
Graph 8: Gross revenue in rand per hectare for wheat compared with maize and soybean in absolute annual and linear terms between 1995 and 2014.
Source: BFAP, 2014