Market overview
Markets
Overview of the grain markets
WANDILE SIHLOBO, FUNZANI SUNDANI AND PETRU FOURIE, ECONOMISTS:
INDUSTRY SERVICES, GRAIN SA
Since 9 December 2013, there have been significant increases in the
domestic grain market. The main factors behind these movements have
been the exchange rate, old season stock levels in the USA, weather
conditions in South America as well as the demand from Asia and Africa.
International markets
Maize
On the international markets, much focus has been on the recent
US maize ending stocks for 2013/2014 that are projected at
406 400 000 tons, which is 40 894 tons lower than the previous estimate
(WASDE, 2014). There have been some major concerns about the
rejection of US maize by China, due to unapproved GMO variety
(International Grains Council [IGC], 2014).
In 2013, China rejected about 601 000 tons of US maize and maize
by-products. In South America, plantings in Argentina made limited
progress, with seeding finished on 4,4 million hectares (IGC, 2014).
Earlier rains in Argentina did help on the drought-affected crops; however
the return of dry, hot weather has raised some major concerns about the
yield prospects. In Brazil, after harsh, dry conditions in the early stages
of planting; recent rains were favourable for full season 2013/2014 maize
production.
Soybean
According to World Agricultural Supply and Demand Estimates (WASDE)
(2014) global soybean production for 2013/2014 is estimated at a record
of 286,8 million tons, up by 1,9 million tons; with major gains coming
from the US and Brazil. US 2013/2014 soybean production is estimated
to reach a record of 88,7 million tons (WASDE, 2014). At the same time,
Brazilian soybean production is estimated to increase by 1 million tons to
a record of 89 million tons; much of the increase is due to the increased
area that was planted.
Brazil starts harvesting in March and Argentina in April and it is expected
that price relief will be experienced from the end of February. In Argentina,
2013/2014 soybean production is estimated to be 57,5 million tons, which
is higher than last year’s production of 49,3 million tons (IGC, 2014).
On the other hand, there has also been consisted export demand in the
world market, with a large stake coming from China. China has recently
purchased about 350 00 tons of US soybeans.
Wheat
Analysis shows that global 2013/2014 wheat supplies have increased
by 1,5 million tons to 888,8 million tons. A large part of production is
expected from China and Russia. For 2013/2014 wheat production, China
is expected to increase by 1 million tons, at the same time in Russia,
wheat production is expected to increase by 300 000 tons. In the US, cold
weather temperatures have been a major concern for their winter wheat
production (IGC, 2014).
In South America, production is expected to decrease with 500 000 tons
in Argentina, due to an expected decrease in the harvested area. In the
European Union, 2013/2014 wheat production is expected to decrease by
200 000 tons, with slight downward revisions for the United Kingdom,
Finland and Denmark (WASDE, 2014).
Increasing demand is still observed from Egypt, Algeria, Japan and
Syria (IGC, 2014). The IGC (2014) further noted that favourable weather
conditions in India contributed to a 6% year-on-year increase in the area
planted, thus an expected increase in production. Some traders are of
the view that the government’s production
target of 92,5 million tons in India is going to
be exceeded.
Macroeconomic factors
Exchange rate
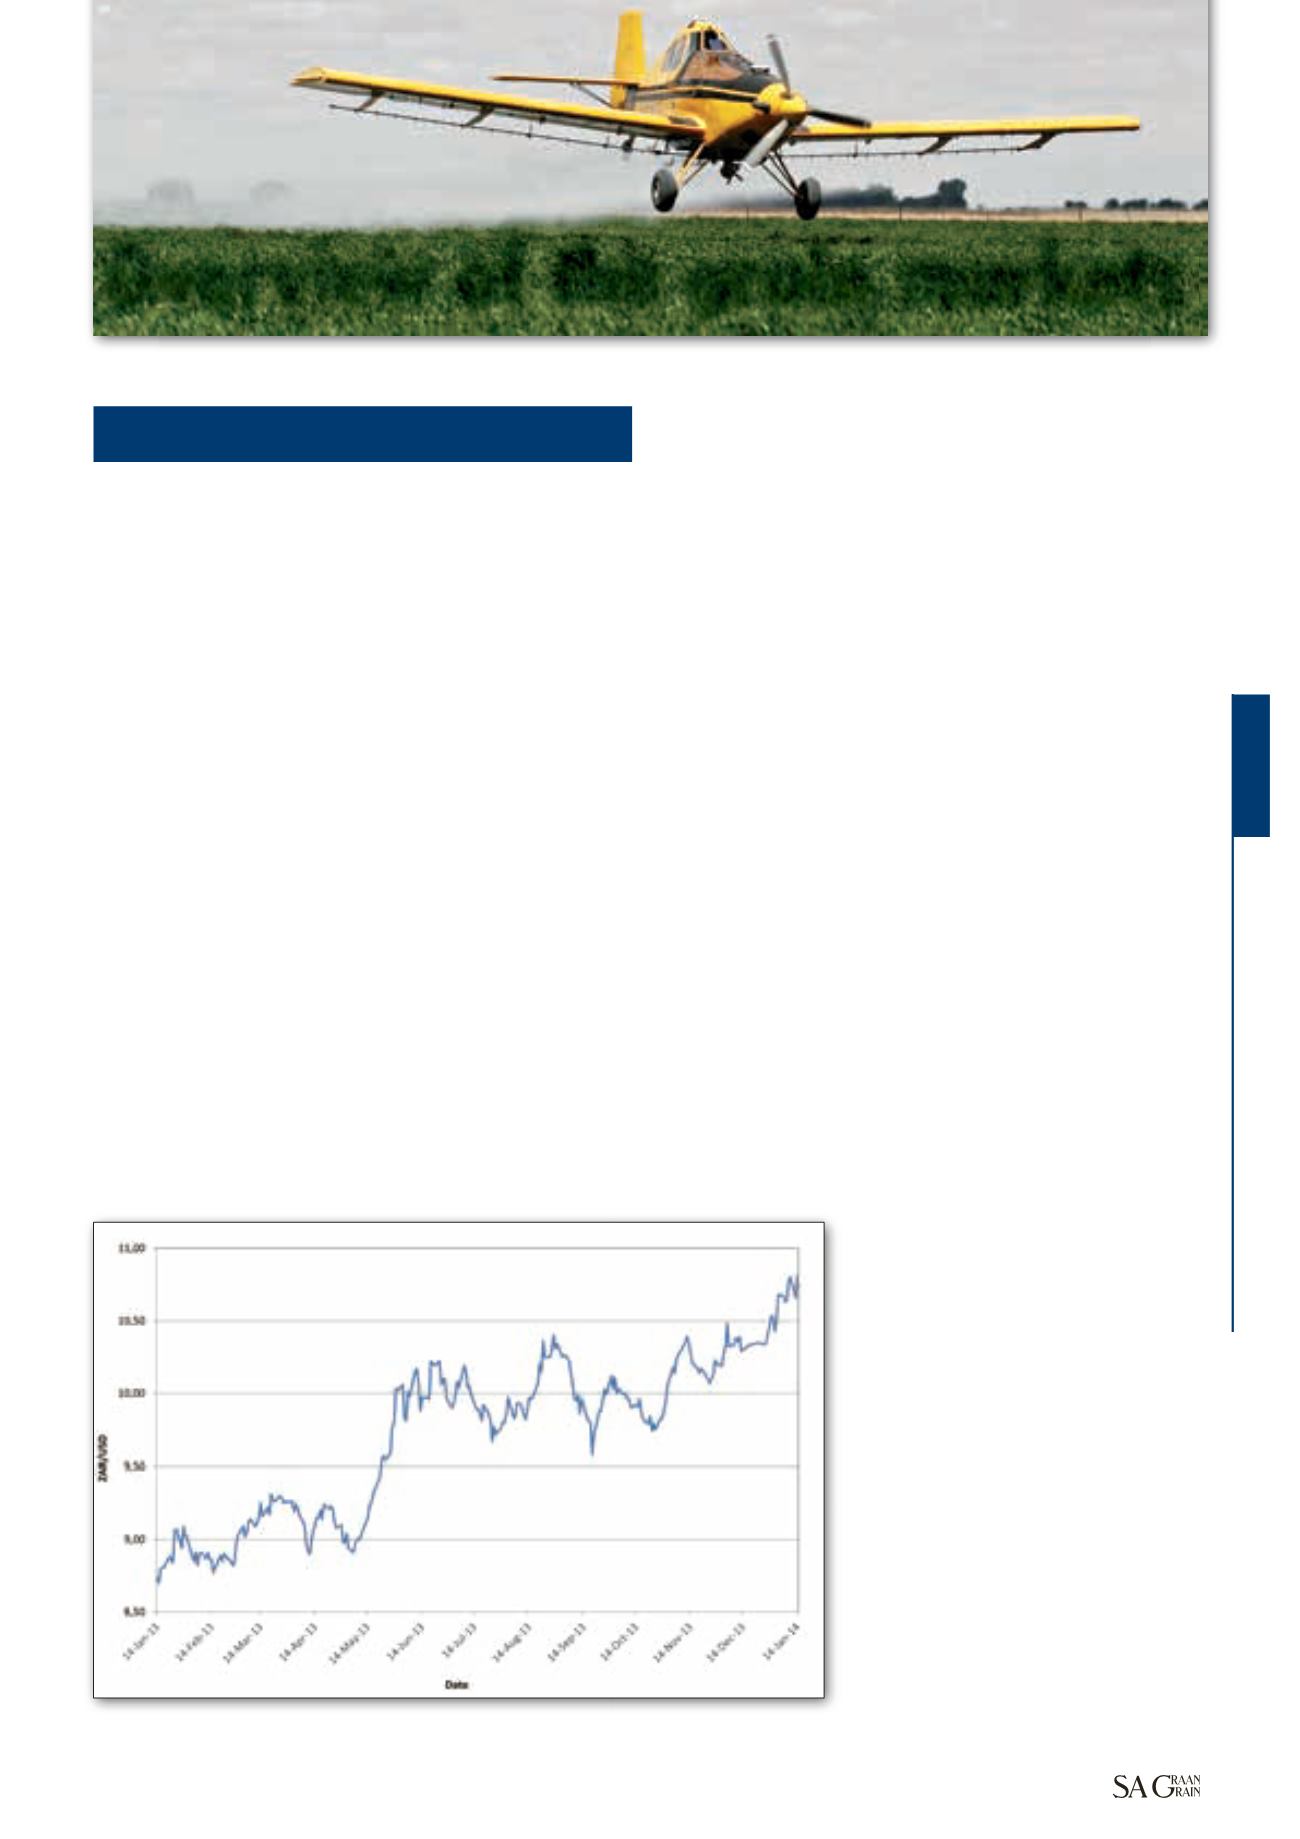
During the past month, the rand has
significantly weakened against most major
currencies, reaching the high levels of R10,81
to the US dollar on 14 January 2014. From
14 January 2013 to 14 January 2014, the South
African rand has weakened by approximately
23%; from R8,73 to R10,81.
There are a number of domestic factors that
have contributed to the significant weakening
of the rand value, ranging from the widening
current account and budget deficit to global
economic conditions, but the most recent one
was the announcement by the United States
Federal Reserve bank (US Fed) of the start of
bond tapering this month (Nedbank Group
Economic Unit, 2014).
53
February 2014
Graph 1: Exchange rate.
Source: Grain SA (2013)
– 15 January 2014
SA Grain/
Sasol Nitro photo competition
Continued on page 54


