


 76 / 112

FOCUS
Soybeans
Mini
The national weighted average increased
slightly from 1,95% last season to 2,02%
this season.
The South African weighted average per-
centage soiled soybeans of 2,06% is the
highest since this survey was started in the
2011/2012 season when the average was
1,60%. The average last season was 0,77%.
Average weighted percentages per prov-
ince ranged from 1,28 in the Northern Cape
to 4,46 in Limpopo. Although the number
of samples containing soiled soybeans as
well as the average percentage soiled soy-
beans per sample increased significantly,
none of the percentages were above the
maximum permissible deviation of 10%
according to the grading regulations. Last
season, one sample from Mpumalanga
exceeded this limit.
Test weight, providing a measure of the
bulk density of grain and oilseeds, does
not form part of the grading regulations for
soybeans in South Africa. An approxima-
tion of the test weight of these crop sam-
ples was done by determining the g/1 litre
filling weight of each sample using the Kern
222 apparatus.
The test weight was then extrapolated by
means of formulas obtained from the Test
Weight Conversion Chart for Soybean of the
Canadian Grain Commission. The weighted
average this season was 70,9 kg/hl. Indi-
vidual values ranged from 64,9 to 73 kg/hl.
Last seasons’ values ranged from 63,3 to
78,2 kg/hl and also averaged 70,9 kg/hl.
Soybeans are the most important oilseed
crop produced in South Africa, driven
mainly by the demand for protein feed in
the animal feed industry. The nutritional
component analyses, namely crude protein,
- fat, - fibre and ash are reported on a dry/
moisture-free basis (db).
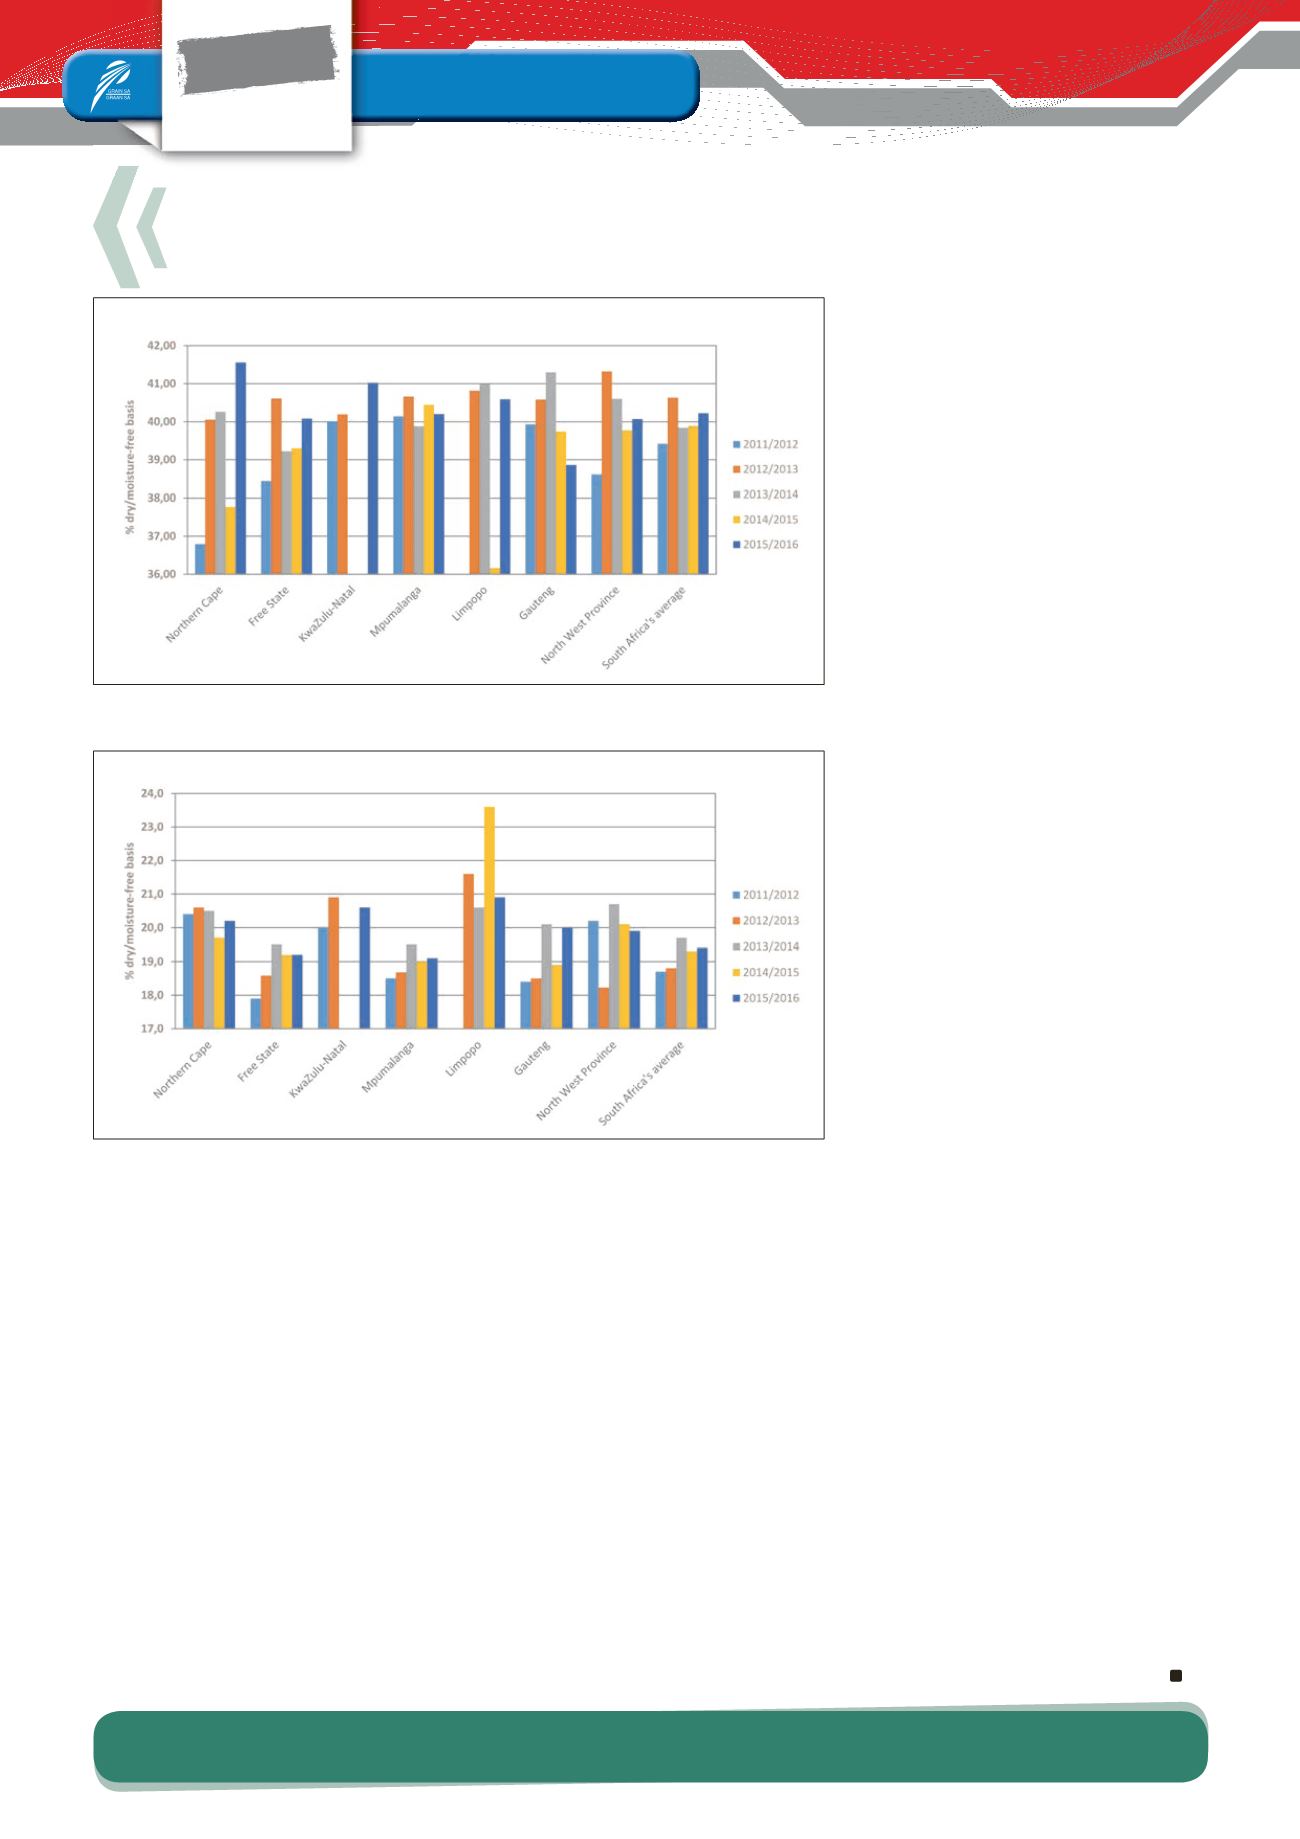
The weighted average crude protein con-
tent this season was 40,22%, slightly higher
than the 39,89% and 39,84% of the previous
two seasons. The sample from the North-
ern Cape had the highest weighted average
crude protein content of 41,56%, with Gau-
teng reported the lowest average, namely
38,86%. See
Graph 2
.
The weighted average crude fat percentage
of 19,4% compared very well with the 19,3%
in 2014/2015. The samples from KwaZulu-
Natal had the highest weighted average
crude fat content of 20,6%. The lowest av-
erage fat content was observed in Mpuma-
langa with 19,1%. See
Graph 3
.
The weighted average percentage crude
fibre varied from 6,2% in Limpopo to 7,6%
in the Northern Cape. The South African
weighted average of 7,3%, was higher this
season than in the previous season, when
the average was 6,4%.
A small variation of only 0,05% is observed
with regards to the national weighted aver-
age ash content over the five seasons that
this survey has been conducted. This sea-
son, the average ash content was 4,61%.
Samples from the Northern Cape and Lim-
popo tend to show higher ash contents over
seasons.
The majority of soybeans produced/grown
in South Africa is genetically modified and
an estimated 95% of the area planted to
soybeans in South Africa was GM. These
soybeans have tolerance to herbicides
(chemical products used to destroy weeds,
but not the crop plants). Worldwide, GM
soybeans occupy 80% of the area planted
to soybeans.
15 (10%) of the crop samples were screened
by means of the EnviroLogix QuickComb
kit for bulk soybeans, to quantitatively de-
termine the presence of the CP4 EPSPS
trait (Roundup Ready®) and all the samples
tested positive.
The results of this survey are available on
the SAGL website (
www.sagl.co.za ). The
hard copy reports are distributed to all the
directly affected groups and interested par-
ties. The report is also available for down-
load in a PDF format from the website.
Soybean crop quality overview of the 2015/2016 season
Graph 2: Average crude protein content per province over five seasons.
Graph 3: Average crude fat content per province over five seasons.
Augustus 2017
74
We are grateful to the Oil & Protein Seed Development Trust for financial support of these
annual surveys and to the members of Agbiz Grain for providing the crop samples.