


 75 / 112

Soybean crop quality overview
of the 2015/2016 season
T
he extreme drought conditions ex-
perienced during the 2015/2016
season, led to an almost 27%
(184 500 ha) decline in soybean
production area. Yield was also negatively
impacted, with the average national yield
decreasing from 1,56 t/ha in 2014/2015 to
1,47 t/ha.
The result was an almost 31% (328 000 tons)
decline in the commercial soybean crop
compared to the previous season.
Sunflower production surpassed soybean
production for the first time since the
2010/2011 season. The major soybean-pro-
ducing provinces, contributing 75% of the
total crop, were Mpumalanga and the Free
State. Figures were obtained from the Crop
Estimates Committee.
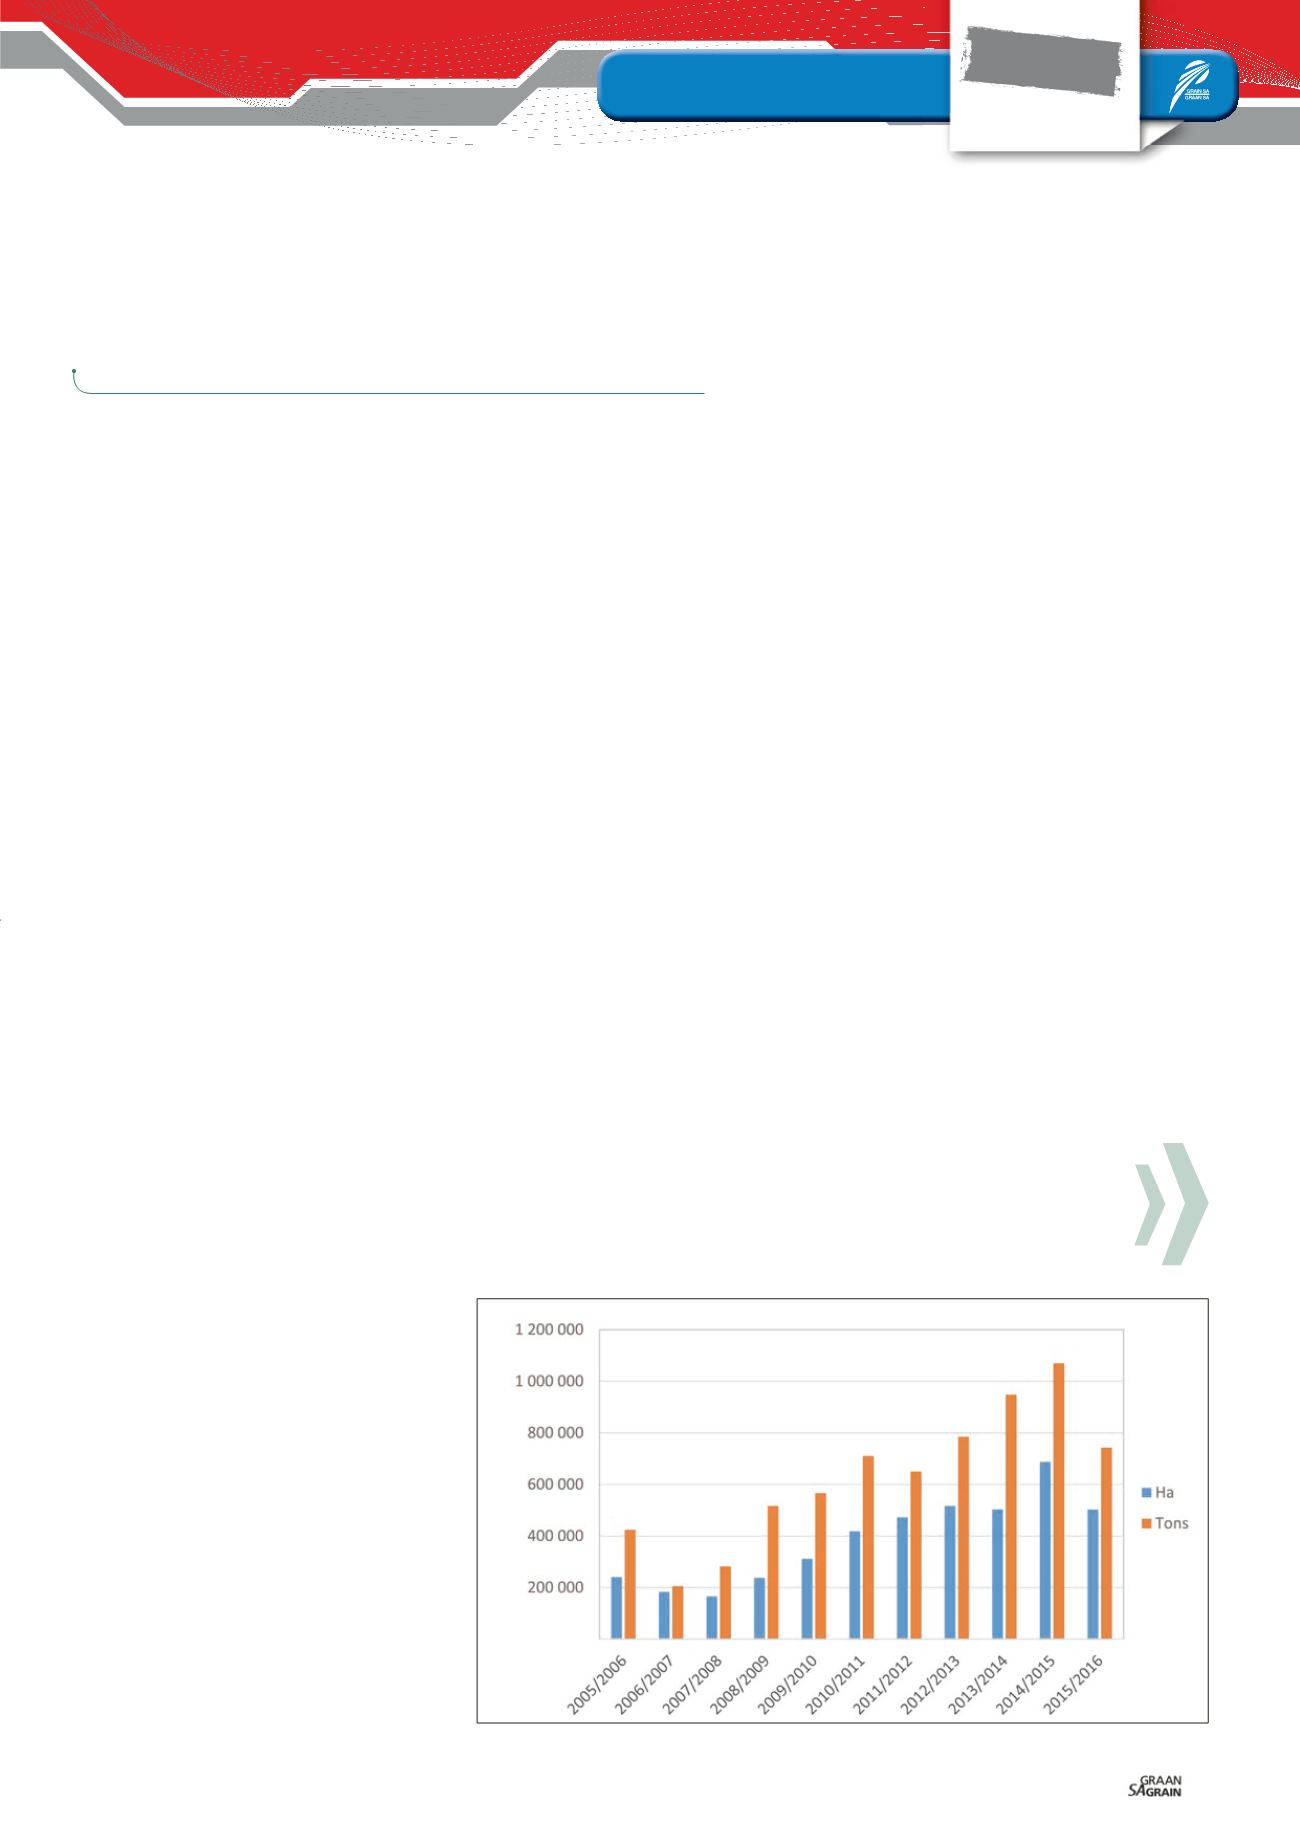
According to the Bureau for Food and Agri-
cultural Policy (BFAP) Baseline, Agricultural
Outlook 2016 to 2025, a high demand for
soybeans arising from expanded crushing
capacity is expected to cause a sharp in-
crease in area utilised for soybean produc-
tion in 2017 (
Graph 1
). Assuming normal
rainfall patterns, production is expected
to recover to more than 900 000 tons
this year.
An estimated 312,81 million metric tons
of soybeans were produced during the
2015/2016 season, according to the World
Agricultural Supply and Demand Estimates
Report (WASDE – 563). The United States
contributed 34%, Brazil 31% and Argen-
tina 18% to this total. The world soybean
production during the 2016/2017 season is
projected to be 340,79 million metric tons.
Soybeans account for more than half of
the world’s oilseed production.
During the 2016 harvesting season, a rep-
resentative sample of each delivery of
soybeans at the various silos was taken
according to the prescribed grading regu-
lations. 143 composite soybean samples,
representing the different production re-
gions, were analysed for quality and the
results were published in the fifth annual
soybean crop quality survey report.
Quality results summarised
89% (127) of the 143 samples analysed for
the purpose of this survey were graded
as Grade SB1 and 16 of the samples were
downgraded to class other soybeans
(COSB). During the previous two seasons,
87% (2014/2015) and 88% (2013/2014) of the
samples were graded SB1.
The majority of the samples was down-
graded as a result of either the presence
of poisonous seeds exceeding the maxi-
mum permissible number of either one per
1 000 g or seven per 1 000 g or as a result
of the percentage other grain and/or foreign
matter exceeding the maximum permissible
deviations of 0,5% and 5% respectively.
According to the South African soybean
grading regulations, the determination of
the percentage wet pods in a consignment
shall be done on a working sample of at
least 10 kg of soybeans from a representa-
tive sample of the consignment.
Due to practical considerations, the sam-
ples received at the Southern African Grain
Laboratory (SAGL) from the grain storage
companies, are typically ± 5 kg. Pods were
found in twelve of the 143 samples graded.
All of these pods were green upon receipt
at the SAGL, but not wet according to the
definition. The percentage of these pods
in the samples ranged from 0,05% to
0,50% based on a working sample size of
at least 200 g.
The national average percentage foreign
matter increased over the last five seasons
to the highest level this season, increasing
from 0,34% in 2011/2012 to 0,82% last sea-
son to 0,85%. The samples from the North
West Province had the highest weighted
average percentage, namely 1,62%. The
percentage in the rest of the samples
ranged from 0,26 in the Northern Cape to
0,91 in Mpumalanga.
The number of samples containing sclerotia
increased from 20 in the previous season to
36 this season. The highest percentages of
sclerotia observed (0,76% and 0,64%) were
on samples from Mpumalanga, followed by
a sample from North West Province with
0,60%. These percentages are, however,
still well below the maximum permissible
level of 4%. The national weighted average
percentage this season was 0,04% com-
pared to the 0,01% of the previous season.
North West Province (eight samples) re-
ported the highest weighted average per-
centage soybeans and parts of soybeans
above the 1,8 mm slotted sieve which pass
through the 4,75 mm round hole sieve,
namely 1,56% and the sample from the
Northern Cape the lowest at 0,40%.
Mpumalanga with the highest number of
samples (91) reported an average of 0,90%.
The Free State averaged 1,03% (23 sam-
ples). The national weighted average per-
centage decreased from 1,81% the previous
season to 0,92% this season.
The lowest weighted average percentage
defective soybeans on the 4,75 mm sieve
was observed on the samples from Mpu-
malanga, namely 1,46%. The Northern Cape
reported the highest percentage of 4,94,
followed by North West Province and Kwa-
Zulu-Natal with 3,99 and 3,34 respectively.
73
August 2017
FOCUS
Soybeans
Mini
JOLANDA NORTJÉ,
laboratory manager, Southern African Grain Laboratory NPC
Graph 1: Tonnage and area utilised for soybean production since the 2005/2006 season.