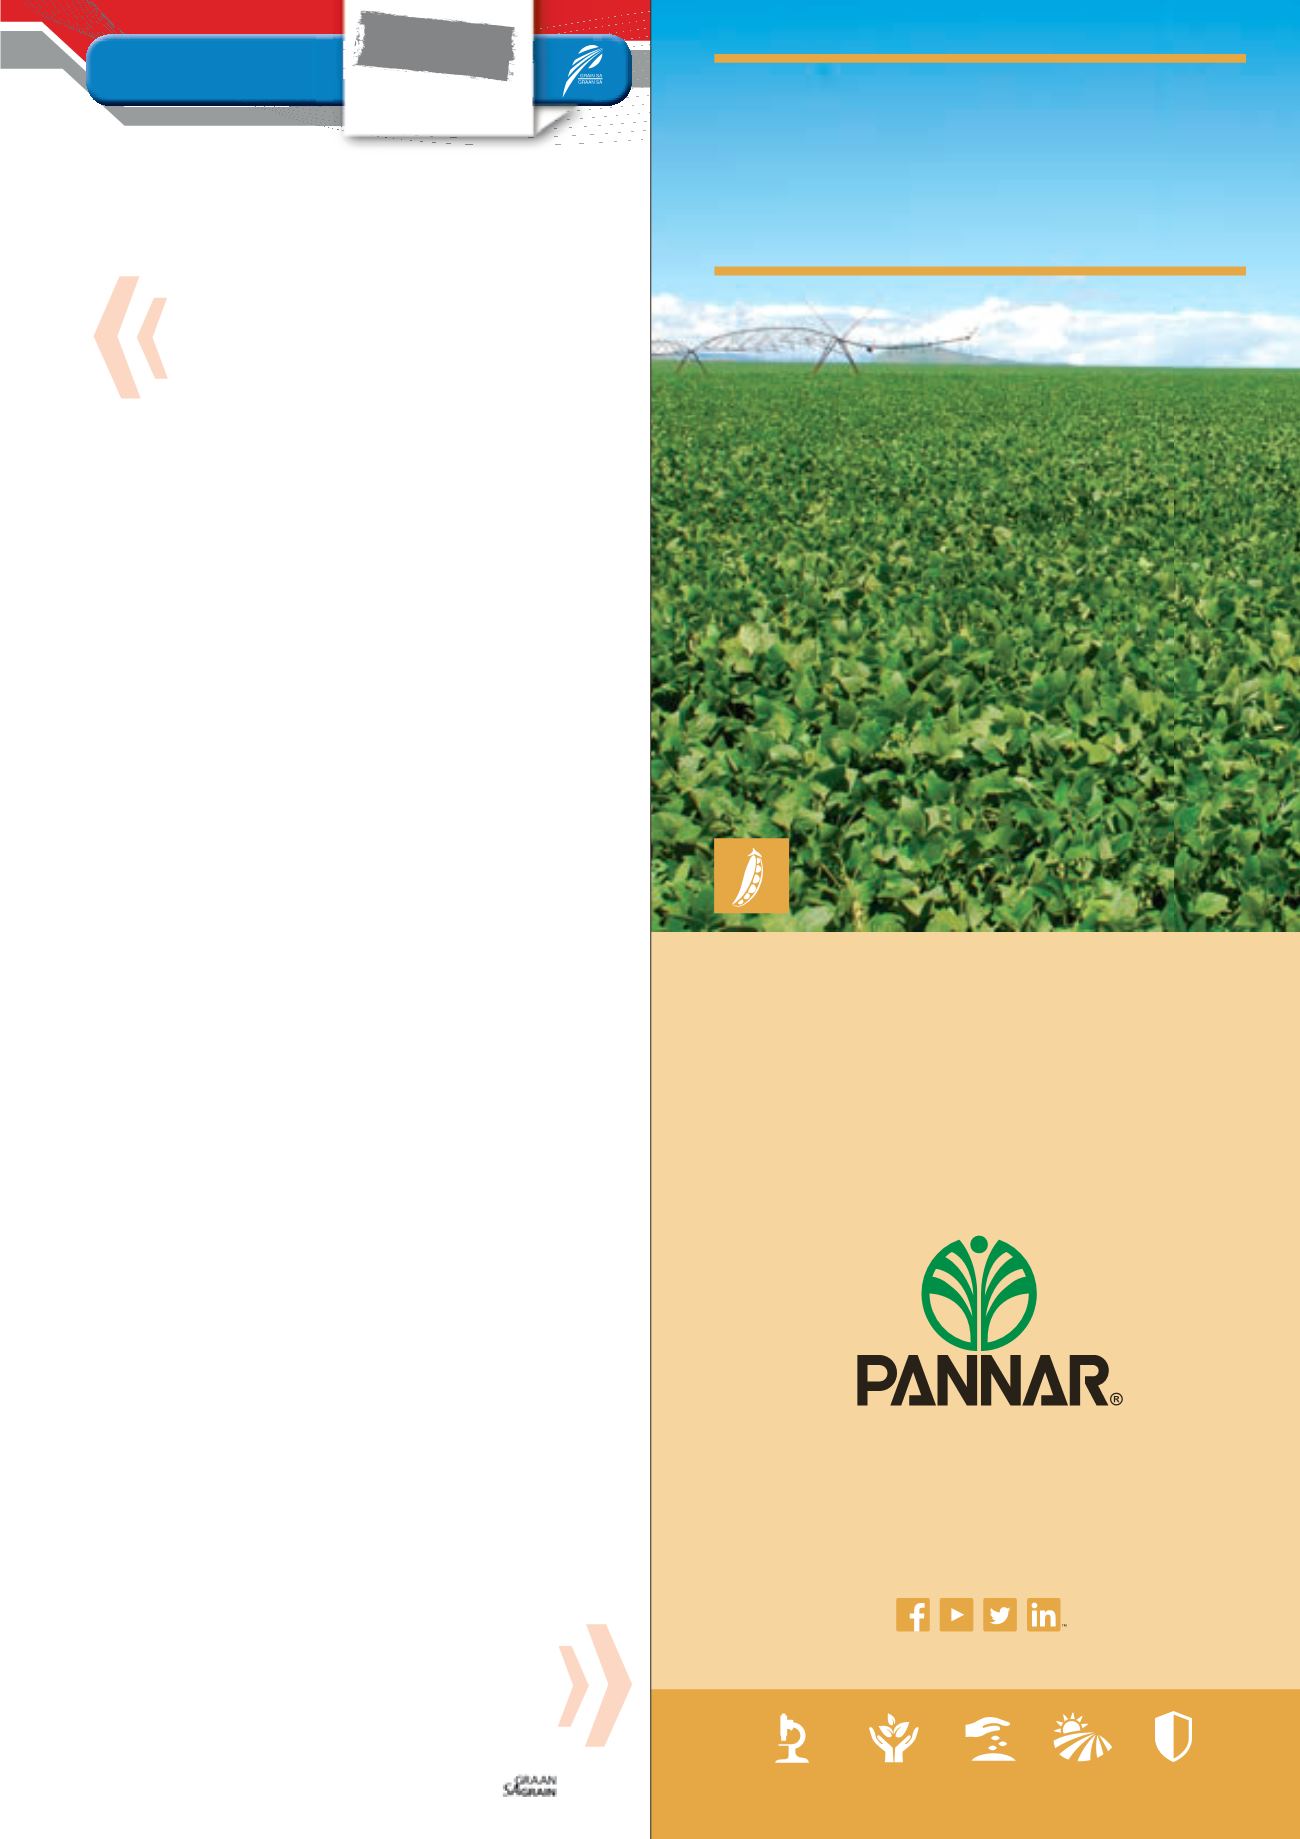

Ons handhaaf ’n uitstaande rekord van prestasie
in die nasionale sojaboonproewe, jaar na jaar.
Ons veelsydige pakket bied die optimale kultivar
om jou winsgewendheid te verbeter.
Sojabone waarop jy kan staatmaak.
® Geregistreerde handelsmerke van PANNAR BPK, © 2016 PANNAR BPK
2016/SOY/A/15
www.pannar.com infoserve@pannar.co.zaSaam boer ons
vir die toekoms
™
VAN PLAAS TOT
HUIS: ’N BEWESE
SUKSESREKORD.
UITSONDERLIKEPRODUKTE
ENGEWASPAKKETTE
ULTRAMODERNE
NAVORSINGEN
ONTWIKKELINGSTEGNOLOGIE
GEWASVOORSORG
OPTIMALISEER
PRODUKSIE
GEWASBESKERMINGS-
BESTUURSPRAKTYKE
73
FOCUS
Soybeans
Mini
Limpopo’s two samples had the highest average percentage
foreign matter. The weighted average percentage foreign matter in
the rest of the samples ranged from 0,54 in the Northern Cape to
0,95 in the North West Province.
The North West Province (18 samples) reported the highest weight-
ed average percentage soybeans and parts of soybeans above the
1,8 mm slotted sieve which pass through the 4,75 mm round hole
sieve, namely 2,15% and Limpopo (two samples) the lowest at 0,67%.
Mpumalanga, with the highest number of samples (77), reported
an average of 1,78%. The Free State averaged 1,77% (42 samples).
The national weighted average percentage increased from 1,36%
last season to 1,81% this season. No samples were received from
KwaZulu-Natal for the 2013/2014 and 2014/2015 seasons. See
Graph 1
and
Graph 2
.
Eight samples were submitted from Gauteng and the lowest
weighted average percentage defective soybeans on the 4,75 mm
sieve were reported on these, namely 1,51%. Mpumalanga report-
ed the highest percentage of 2,12, followed by the Northern Cape
and the North West Province with 2% and 1,99% respectively. The
national weighted average increased from 1,07% in the previous
season to 1,95% this season.
The South African weighted average percentage soiled soybeans
of 0,77% was lower than the 0,89% of the previous season but
higher than the weighted average (0,41%) of the 2012/2013 season.
Average weighted percentages per province ranged from 0,38 in
the Northern Cape to 1,43 in Limpopo. This season one sample from
Mpumalanga had a soiled soybean percentage exceeding the maxi-
mum permissible deviation of 10%, none above the limit were ob-
served during the 2013/2014 season.
Test weight provides a measure of the bulk density of grain and
oilseeds and does not form part of the grading regulations for
soybeans in South Africa. An approximation of the test weight of
South African soybeans is done by determining the g/1 L filling
weight of the 150 soybeans samples by means of the Kern 222 ap-
paratus.
The test weight was extrapolated by means of the following formu-
las obtained from the Test Weight Conversion Chart for Soybean
of the Canadian Grain Commission: y = 0,1898x + 2,2988 (291 to
350 g/0,5 L) and y = 0,1895x + 2,3964 (351 to 410 g/0,5 L). The na-
tional weighted average test weight was 70,9 kg/hl and ranged from
63,3 kg/hl to 78,2 kg/hl. The national average the previous season
was 71 kg/hl, varying between 66,6 kg/hl and 74,7 kg/hl. The highest
weighted provincial average was reported for the samples from the
Northern Cape and the lowest for the samples from Limpopo.
The EnviroLogix QuickComb kit for bulk soybeans was used to
quantitatively determine the presence of genetically modified soy-
beans. The kit is designed to extract and detect the presence of cer-
tain proteins at the levels typically expressed in genetically modified
bulk soybeans. 15 of the crop samples were screened to test for the
presence of CP4 EPSPS (Roundup Ready) and all samples tested
positive.
All the soybean samples were milled on a Retch ZM 200 mill fitted
with a 1 mm screen, prior to the nutritional component analyses. The
crude protein, fat, fibre and ash are reported on a dry/moisture-free
basis (db) for the purposes of the survey. For comparison purposes
however, the national ‘as is’ basis results are provided in
Table 1
.
These ‘as is’ values were calculated using the weighted national
average values.
A look at the soybean crop quality


