


 73 / 116

71
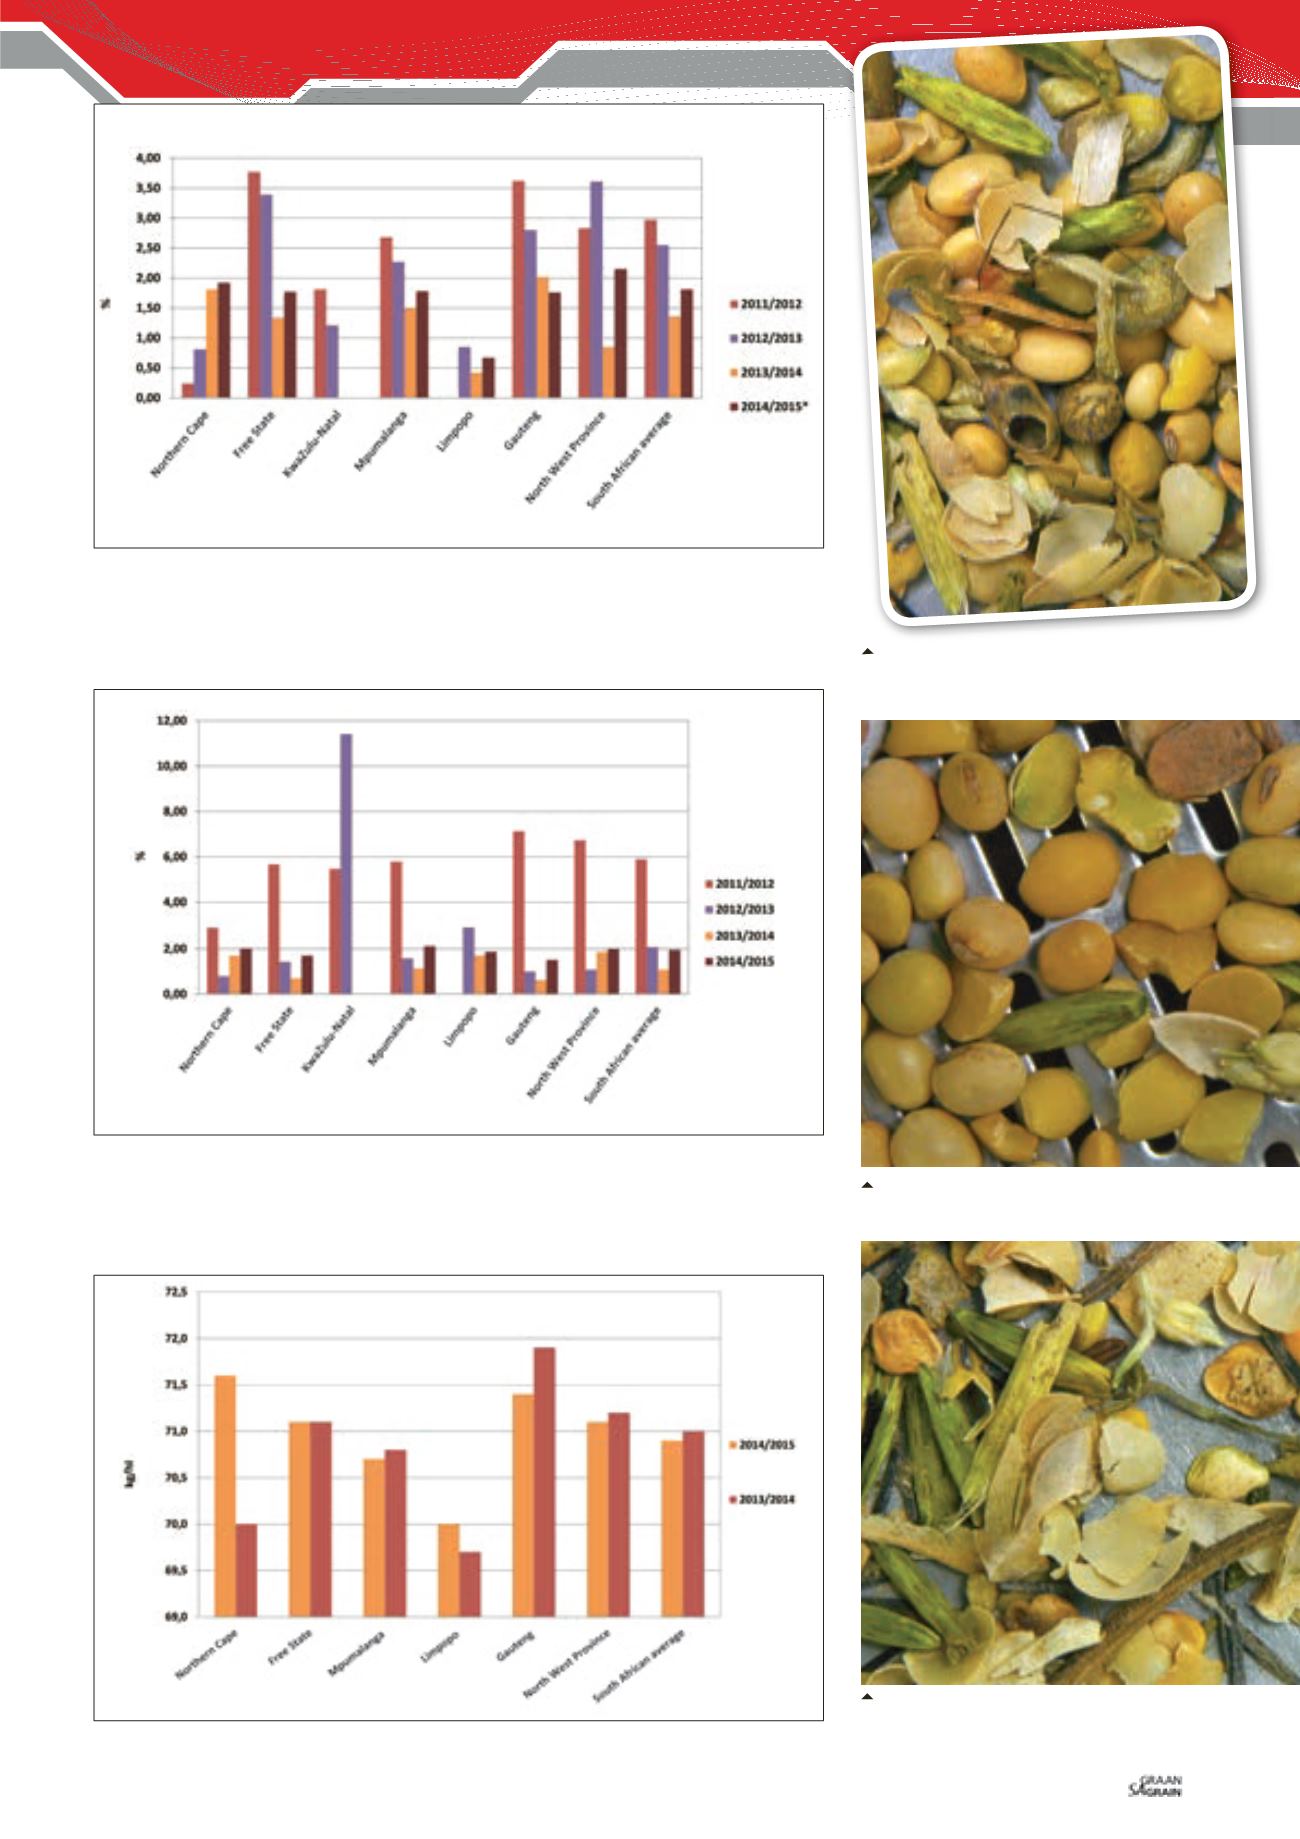
Graph 1: Average percentage soybeans and parts of soybeans which pass through the 4,75 mm
round hole sieve per province over four seasons.
*Please note that the 2014/2015 results represent soybeans and parts of soybeans above the 1,8 mm
slotted sieve which pass through the 4,75 mm sieve.
Graph 2: Average percentage defective soybeans on the 4,75 mm round hole sieve per province
over four seasons.
Graph 3: Comparison of the test weight per province over two seasons.
Parts of soybean sample which passed
through the 4,75 mm round hole sieve
(prior to dispensation).
Parts of soybean sample on the 1,8 mm
slotted sieve (according to dispensation).
Parts of soybean sample which passed
through the 1,8 mm slotted sieve (according
to dispensation).