
70
A look at the soybean crop quality of
the 2014/2015 production season
T
he 2014/2015 production season was extremely trying
for producers. Despite this fact, the highest South African
soybean crop ever, namely 1 070 000 tons, was produced.
The area utilised for soybean production increased from
502 900 hectares in the previous season to 687 300 hectares this
season.
The significant impact of the drought experienced this season, is
shown by comparing the 37% increase in area, with the 13% increase
in production, resulting in a yield decrease of 1,89 t/ha in 2013/2014
to 1,56 t/ha. The major soybean producing provinces, contributing
72,5% of the total crop, were the Free State and Mpumalanga.
During the harvesting season, a representative sample of each de-
livery of soybeans at the various silos was taken according to the
prescribed grading regulations. 150 composite soybean samples,
representing the different production regions, were analysed for
quality. These samples represent the fourth annual soybean crop
quality survey.
Summary of results
Full grading was done in accordance with the regulations relating
to the Grading, Packing and Marking of Soybeans intended for
sale in the Republic of South Africa (No. R 478 of 20 June 2014) as
well as Industry-wide dispensations Ref No. 20.4.14.1 dated
6 March 2015 and 12 March 2015 regarding the use of the 1,8 mm
slotted sieve and the 4,75 mm round hole sieve during the grading
of soybeans.
87% (131) of the 150 samples analysed were graded as Grade SB1
and 19 of the samples were downgraded to class other soybeans
(COSB). During the previous two seasons, 12% (2013/2014) and
5% (2012/2013) of the samples were downgraded to class other
soybeans.
The majority of the samples were downgraded as a result of either
the presence of poisonous seeds exceeding the maximum permis-
sible number of either one per 1 000 g or seven per 1 000 g or as
a result of the percentage of other grain present in the samples
exceeding the maximum permissible deviation of 0,5%.
According to the South African soybean grading regulations, the
determination of the percentage wet pods in a consignment shall
be done on a working sample of at least 10 kg of soybeans from a
representative sample of the consignment. Due to practical consid-
erations the samples received at the Southern African Grain Labora-
tory (SAGL) from the grain storage companies is typically ± 5 kg.
Pods were found in 22 of the 150 samples graded, all of these pods
were dry on receival at the SAGL. The percentage of these pods
in the samples ranged from 0,14% to 0,63% based on a working
sample size of at least 200 g. Eleven samples contained pods, not
identifiable as wet pods according to the definition, in percentages
exceeding the wet pod maximum permissible deviation of 0,2%.
Based on the samples received for this crop survey, Sclerotinia
did not pose any problems. The highest percentage of Sclerotinia
observed (0,20%) was on a sample from Mpumalanga, which is
well below the maximum permissible level of 4%. During this
season, the samples from the Northern Cape had the highest weight-
ed average percentage Sclerotinia (0,07%). The national weighted
average percentage this season was 0,01% compared to the 0,03%
of the previous three seasons.
FOCUS
Soybeans
Mini
JOLANDA NORTJÉ,
manager: Laboratory, The Southern African Grain Laboratory NPC
SOUTH AFRICAN SOYBEAN CROP
QUALITY AVERAGES 2011/2012
SOUTH AFRICAN SOYBEAN CROP
QUALITY AVERAGES 2012/2013
Class and grade soybean
SB1
COSB
Average
SB1
COSB
Average
Chemical analysis
Moisture, % (17 hr, 103°C)
6,8
6,8
6,8
7,2
7,2
7,2
Crude protein, % (db)
39,46
39,22
39,42
40,58
41,49
40,63
Crude fat, % (db)
18,6
18,8
18,7
18,8
18,5
18,8
Ash, % (db)
4,61
4,67
4,62
4,65
4,56
4,65
Crude fibre, % (db)
Number of samples
85
15
100
142
8
150
SOUTH AFRICAN SOYBEAN CROP
QUALITY AVERAGES 2013/2014
SOUTH AFRICAN SOYBEAN CROP
QUALITY AVERAGES 2014/2015
Class and grade soybean
SB1
COSB
Average
SB1
COSB
Average
Chemical analysis
Moisture, % (17 hr, 103°C)
7,1
7,2
7,1
7
7,1
7
Crude protein, % (db)
39,8
40,15
39,84
40,05
38,76
39,89
Crude fat, % (db)
19,7
20
19,7
19,2
19,5
19,3
Ash, % (db)
4,66
4,7
4,66
4,63
4,73
4,64
Crude fibre, % (db)
6,2
5,8
6,1
6,4
6,3
6,4
Number of samples
132
18
150
132
18
150
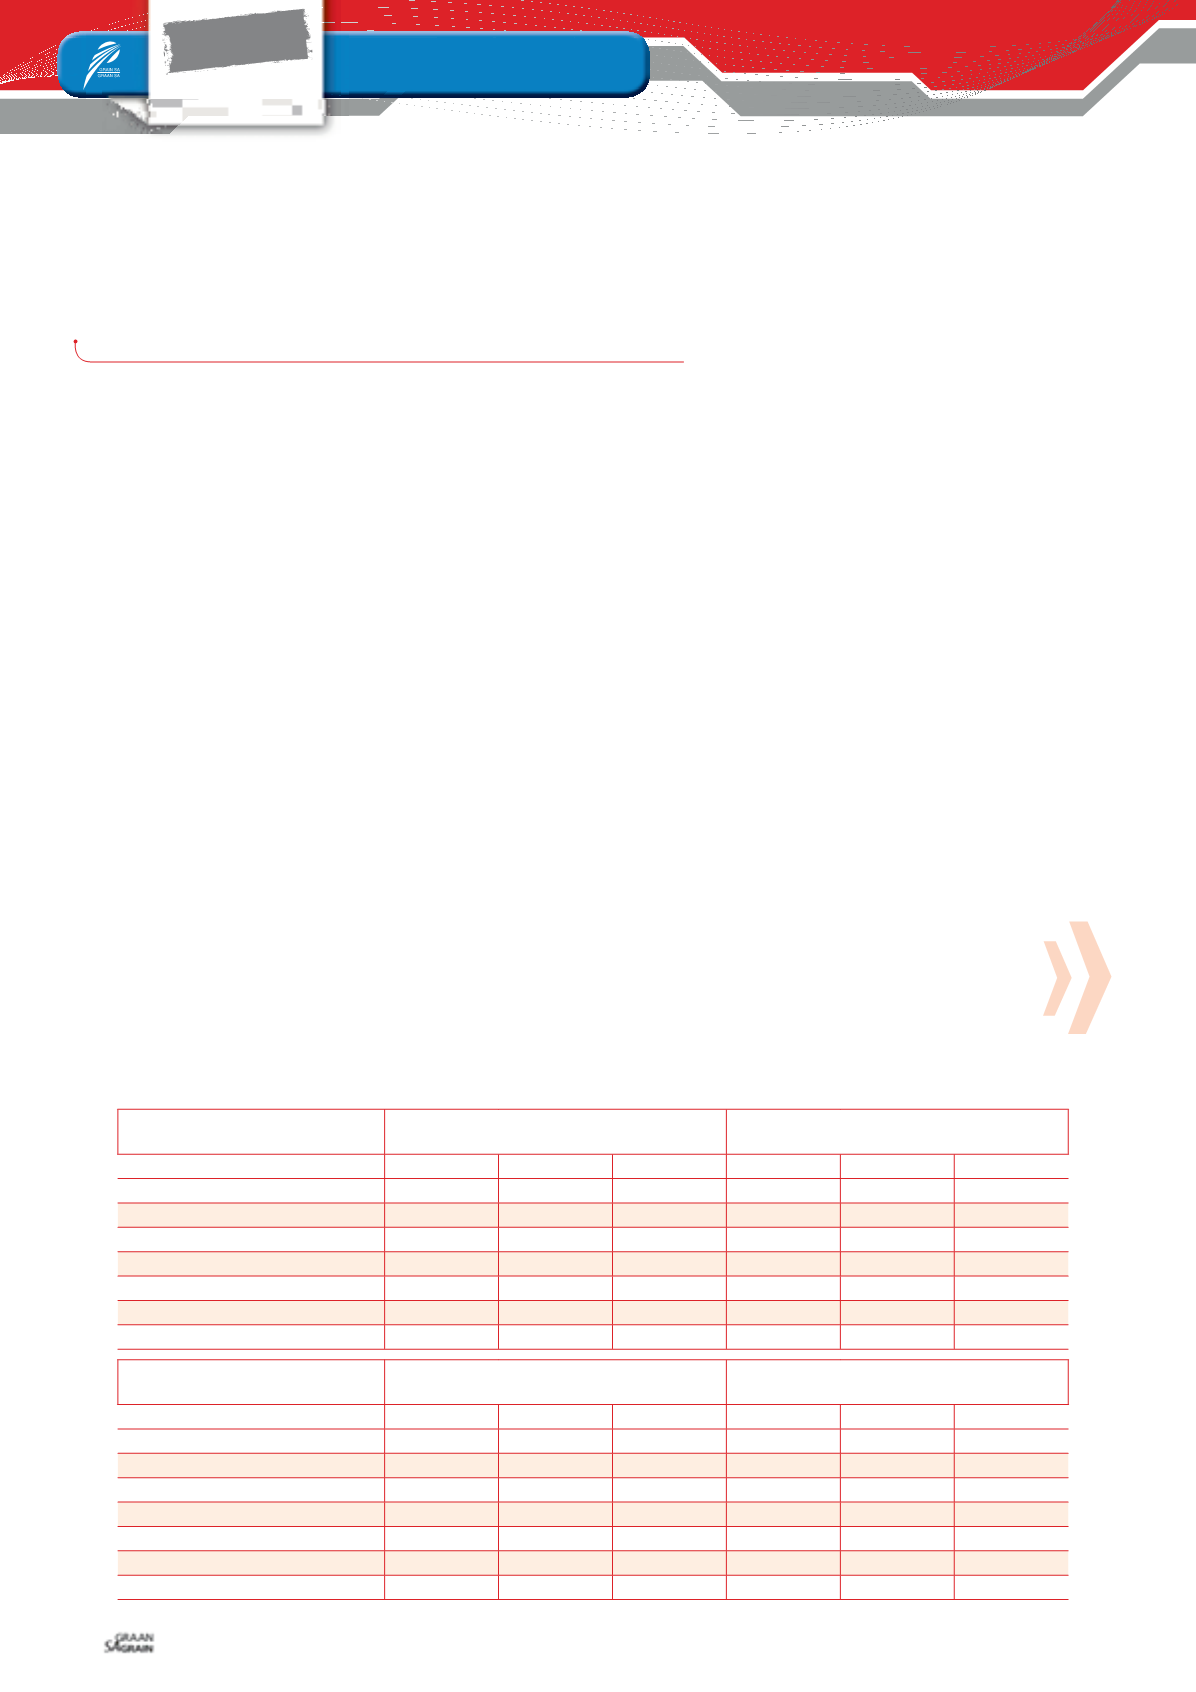
TABLE 1: COMPARISON OF WEIGHTED AVERAGE NUTRITIONAL COMPONENT VALUES ON A DRY AND ‘AS IS’ BASIS OVER
FOUR SEASONS.
Augustus 2016


