


 73 / 116

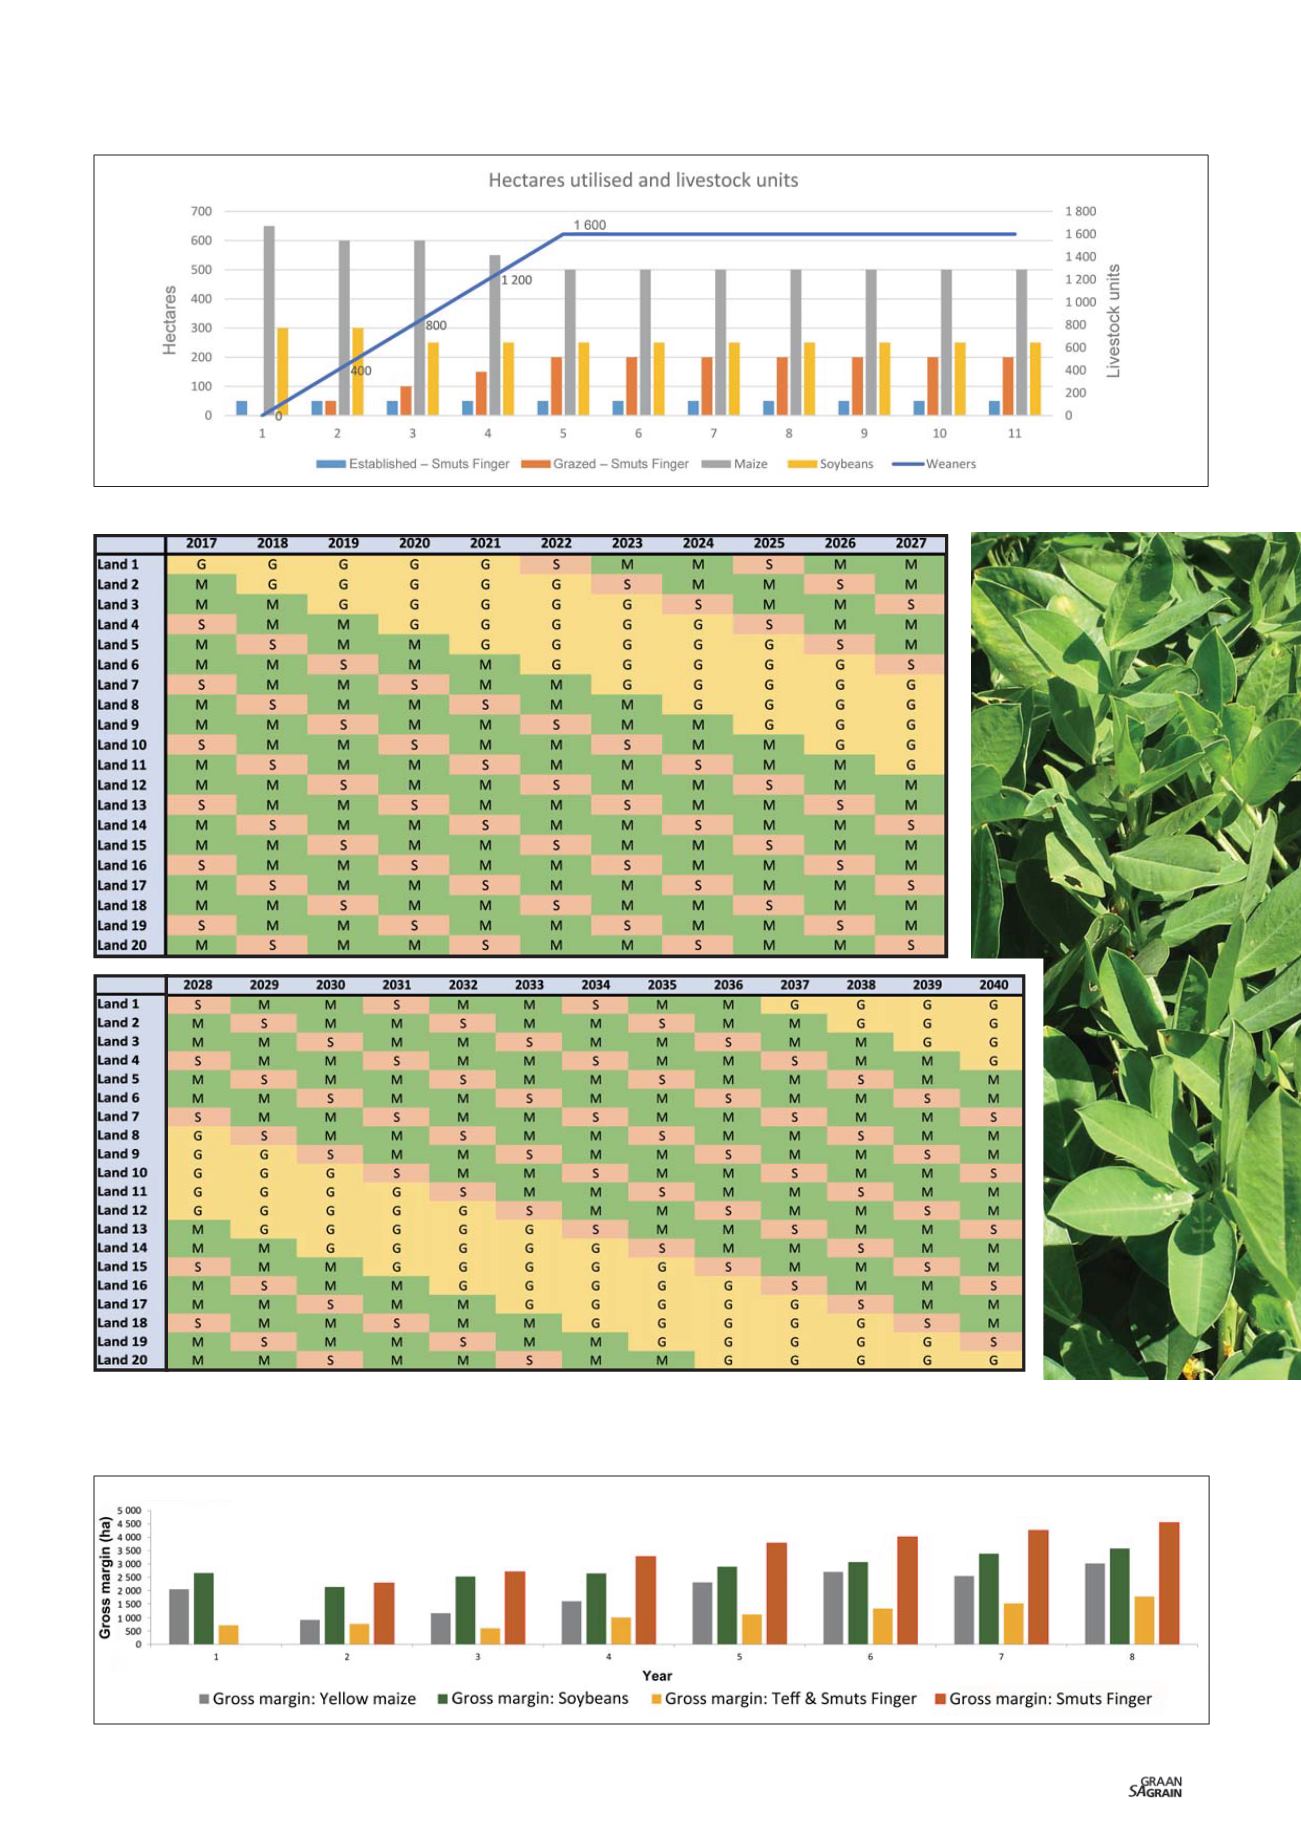
Graph 1: Introducing pastures into CA systems (hypothetical scenario).
Graph 2: Gross margin comparison and break-even analysis.
Figure 1: A 25% pasture ley replacement scenario for a CA system.
G = Grass ley crop
M = Maize
S = Soybeans
71
October 2017
Grain SA/Sasol photo competition