


 33 / 64

INTERNASIONAAL
$
R
JAAR-OP-JAARVERANDERING
Onkruiddoders
-7,60%
11,60%
Insekdoders
-10,70%
7,90%
Kunsmis
-21,40%
-2,10%
TABEL 2: INSETKOSTEBEWEGINGS.
Bron: Graan SA
BEMARKINGSJAAR
SAGIS
GRAAN SA-PROJEKSIE VIERDE NOK-SKATTING
26 APRIL
26 APRIL
GRAAN SA
(
’
000 TON)
GRAAN SA
(
’
000 TON)
GRAAN SA
(
’
000 TON)
2014/2015
2015/2016
2016/2017
Kommersiële aanbod
Beginvoorraad (1 Mei)
589
2 074
1 951
Kommersiële lewerings
13 828
9 420
6 532
Surplus
26
Invoere
65
1 885
3 800
Totaal kommersiële aanbod
14 508
13 379
12 283
Kommersiële vraag
Kommersiële verbruik
9 881
10 225
10 236
Totaal RSA-verbruik (kommersieel)
10 278
10 568
10 604
Uitvoere
2 156
860
810
Totaal kommersiële vraag
12 434
11 428
11 414
Eindvoorraad (30 April)
2 074
1 951
869
Benodigde pyplyn (1,5 maande)
1 235
1 278
1 280
Surplus bo pyplyn
839
673
-410
TABEL 3: SUID-AFRIKAANSE MIELIEVRAAG EN -AANBOD.
Bron: Graan SA
Bron: Graan SA
TABEL 4: WITMIELIESENSITIWITEITSANALISE.
R/TON
2,5 t/ha
3,5 t/ha
4,5 t/ha
5,5 t/ha
6,5 t/ha
3 682
-1 779,13
1 902,87
5 584,87
9 266,87
12 948,87
3 482
-2 279,13
1 202,87
4 684,87
8 166,87
11 648,87
3 282
-2 779,13
502,87
3 784,87
7 066,87
10 348,87
3 082
-3 279,13
-197,13
2 884,87
5 966,87
9 048,87
2 882
-3 779,13
-897,13
1 984,87
4 866,87
7 748,87
2 682
-4 279,13
-1 597,13
1 084,87
3 766,87
6 448,87
2 482
-4 779,13
-2 297,13
184,87
2 666,87
5 148,87
2 282
-5 279,13
-2 997,13
-715,13
1 566,87
3 848,87
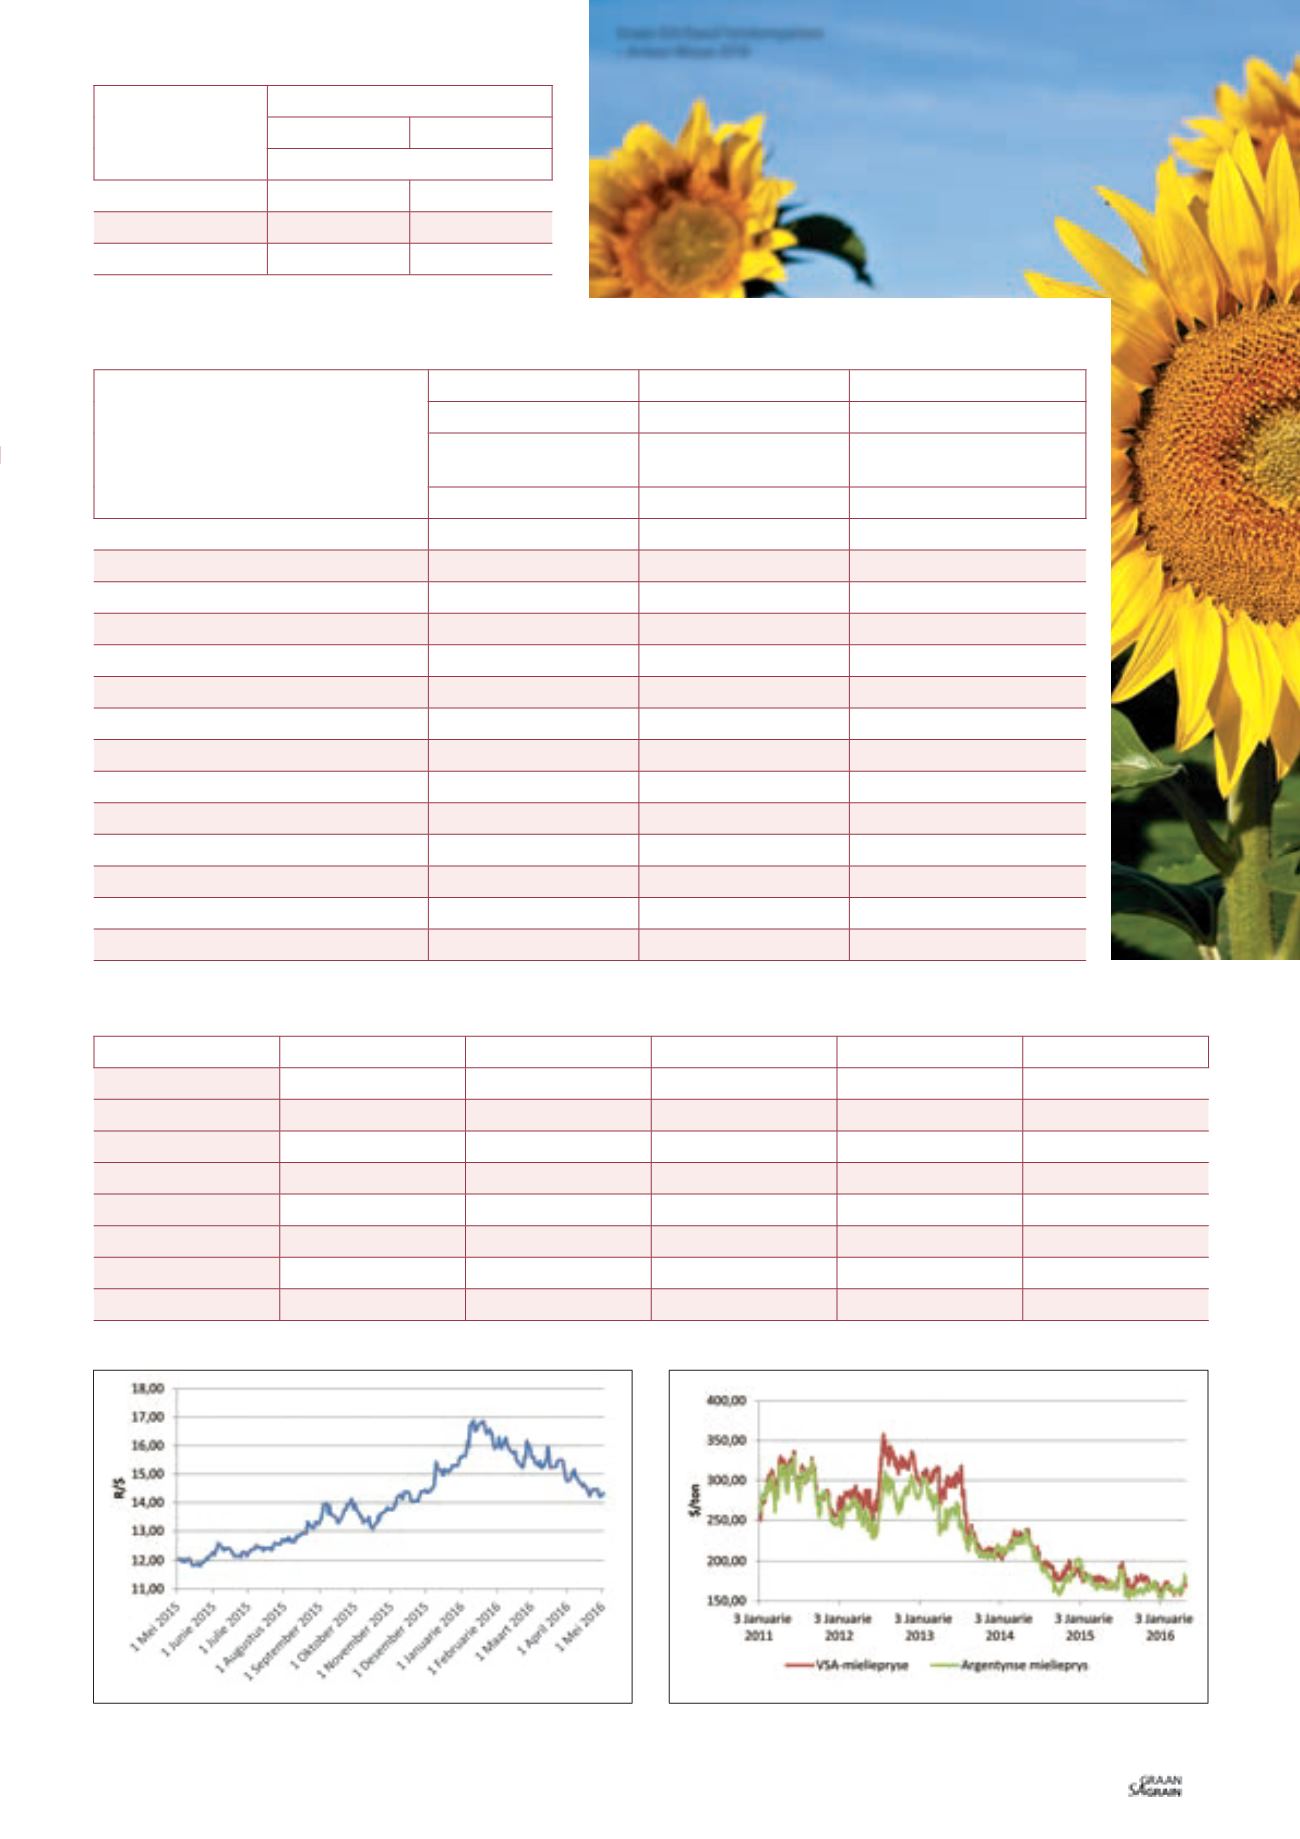
Grafiek 1: R/$-wisselkoers.
Bron: Suid-Afrikaanse Reserwebank
Grafiek 2: Internasionale mieliepryse.
Bron: Graan SA en CME
31
June 2016
Graan SA/Sasol fotokompetisie
– Arleen Wiese 2016