


 46 / 84

FOCUS
Special
Value adding
Junie 2015
44
Using advanced data min-
ing tools
Further analyses of the data can be done us-
ing principal component analyses (for data
clustering) and CART trees. The power of
using both techniques is that if applied cor-
rectly, a similar outcome can be expected.
PCA plots can be very abstract and difficult
to interpret, but clusters can be shown as
groups of data on a 3D plot. For the crop
quality survey data, different seasons ap-
pear as distinct groups on a 3D factor plot. It
supports the result of a CART tree analysis
done where the effects of season, region
and continuous parameters, such as per-
centage protein, were used to predict an
outcome such as Milling Index.
For the eleven year test period, and using
Milling Index data illustrated in Figure 6
as an example, the most important factor
influencing milling quality was season.
Hectolitre mass and percentage protein
were second and third in terms of impor-
tance with the effect of region in fourth
place of importance. In combination, these
factors then produced highly significant
models for future use.
Please contact the SAGL (
wiana.louw@sagl.co.za
) or Dr Corinda Erasmus (
corinda@
iburst.co.za
) for further details. Expla-
nation of the production regions linked
to their numbers can be obtained from
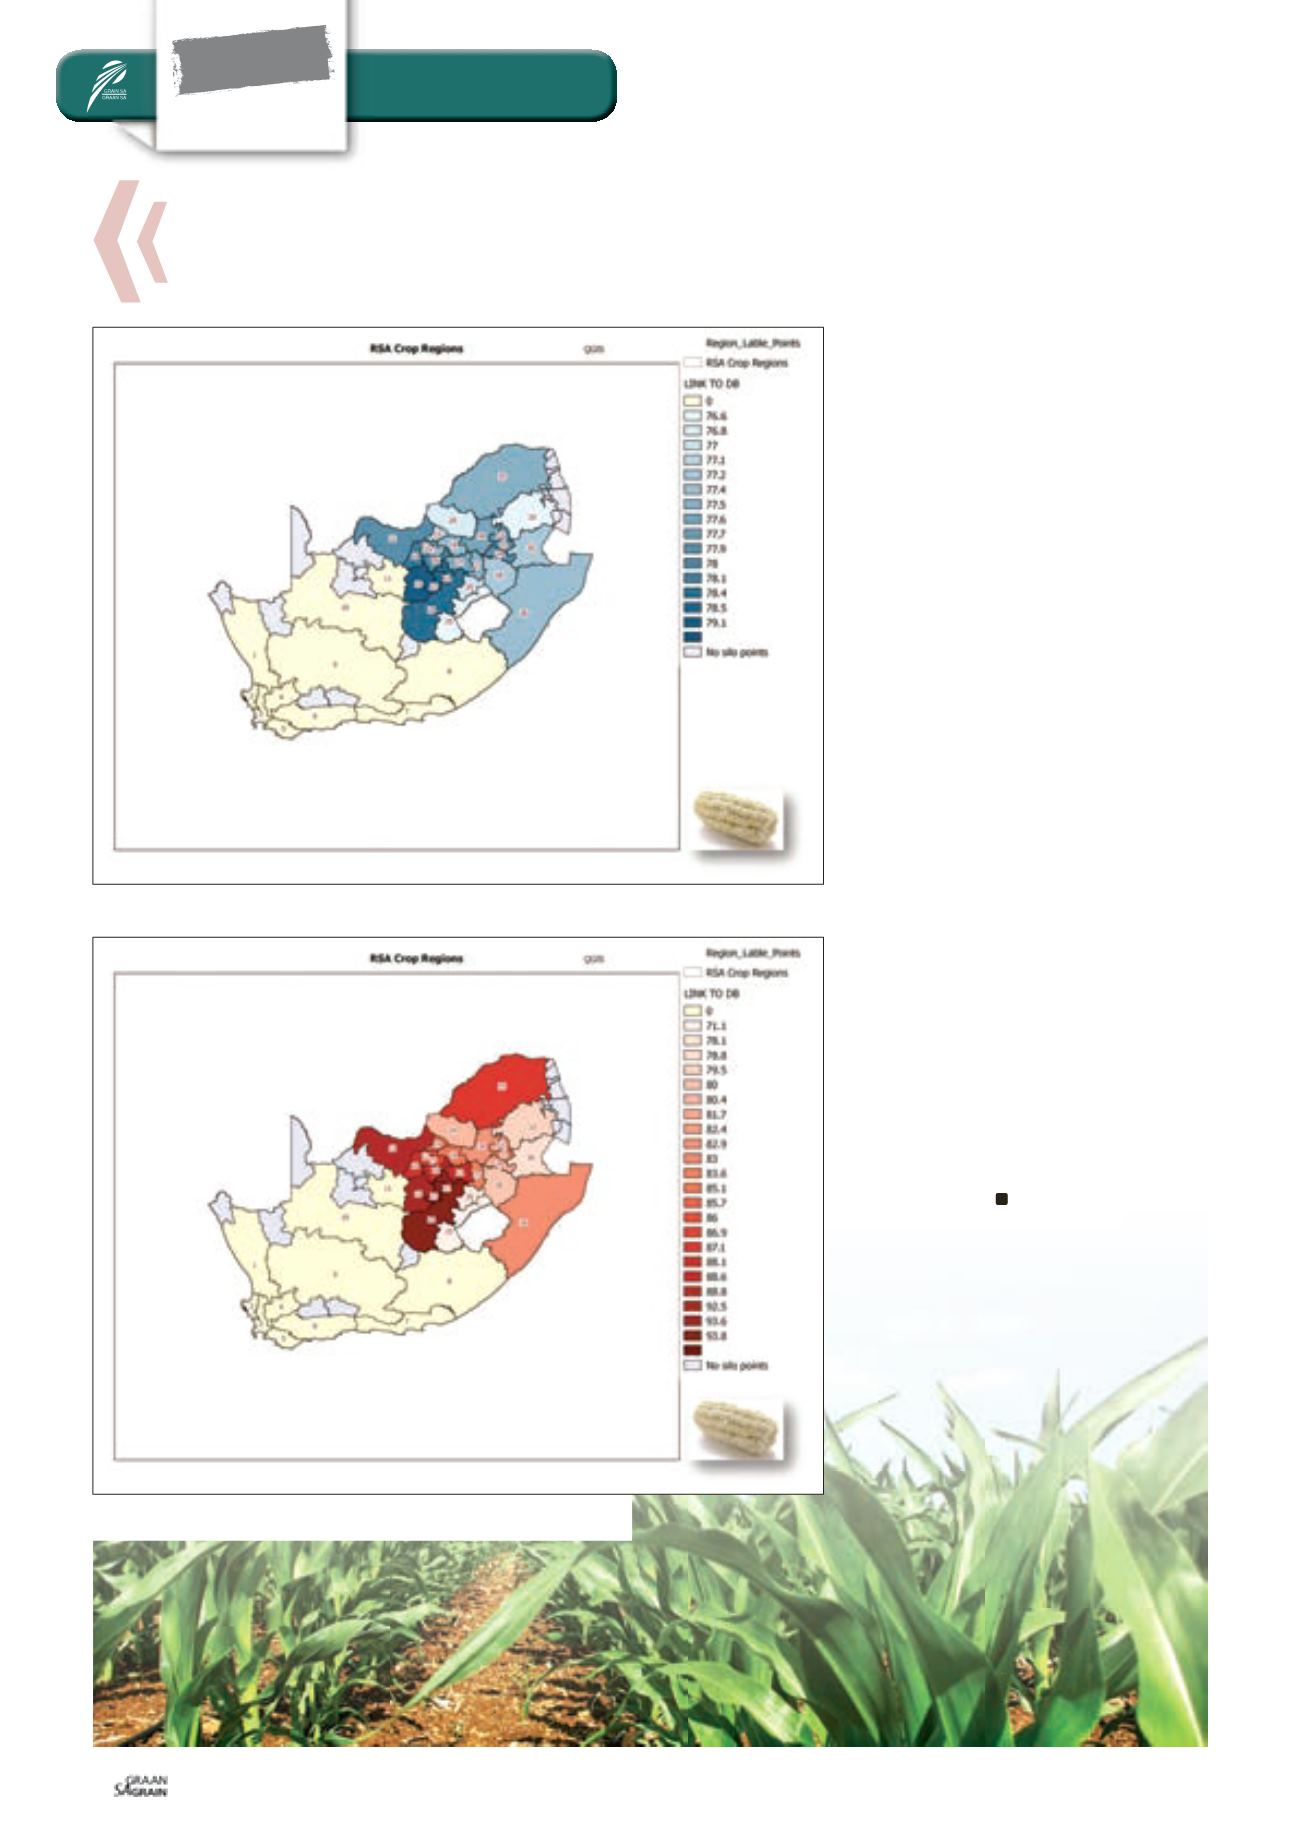
www.sagl.co.za .Figure 5: Hectolitre mass; eleven seasons combined (white maize).
Figure 6: Roff milling index; eleven seasons combined (white maize).
Data mining opens up new possibilities
for identifying maize
crop quality trends