


 44 / 84

Junie 2015
42
Data mining opens up new possibilities
for identifying maize crop quality trends
CORINDA ERASMUS,
STEPS Science Training and
WIANA LOUW
, general manager: Southern African Grain Laboratory
W
hat is data mining? Data min-
ing is the practice of examining
large pre-existing databases
with the objective to generate
new information. Modern data mining soft-
ware allows users to analyse data from
many different angles, categorise it and
summarise the relationships identified.
Although data mining is a relatively new
term, the technology is not. For many years,
for example, companies have used power-
ful computers to sift through volumes of
supermarket scanner data and analyse
market research reports. However, the con-
tinuous innovation in computer process-
ing power, disk storage, and user-friendly
statistical software resulted in dramatic
increases in the accuracy of analyses while
driving down the cost.
It opens up new possibilities for new ap-
plications in disciplines such as agriculture
and food science. Data mining is primar-
ily used today by companies with a strong
consumer focus – retail, financial, commu-
nication, and marketing organisations. With
the increased focus on the requirements of
customers in the agricultural industry, data
mining can be used to determine trends
in the quality of produce as influenced
by factors such as rainfall patterns or farm-
ing practices.
With the financial support of the differ-
ent agricultural trusts, annual crop quality
surveys on the major South African crops
(maize, wheat and more recently oilseeds
and sorghum) are being conducted. Sev-
eral production seasons’ data (in some
cases, such as maize and wheat, almost two
decades of data) are available on crop sam-
ples that have been collected at silo points
throughout the country.
In a pilot project on maize, the Southern
African Grain Laboratory (SAGL) was tasked
with the development of a data mining
protocol that can provide user-friendly
results suitable for use by industry stake-
holders including millers, feed manufactur-
ers and seed breeders among others. Data
from the maize crop (both white and yellow
maize) from eleven seasons (2002/2003 to
2011/2012) was used for this study. More
than ten thousand samples were included.
Data mining analyses levels
Various levels of analyses can be used.
These include artificial neural networks,
genetic algorithms, and decision trees,
such as classification and regression trees
(CART) and Chi Square Automatic Inter-
action Detection (CHAID). These are then
linked with data visualisation which is the
visual interpretation of complex relation-
ships in multidimensional data. Powerful
modern graphics tools are used to illustrate
these data relationships.
Maize crop quality survey
data at the SAGL
One of the challenges with crop quality
survey data is that data sets are skew since
some regions have more than 300 sampling
points while others have less than 50.
This is a result of certain areas in the country
being more suitable for producing a specific
crop than others, and therefore having more
silo points as a result. In order to develop
the statistical models, it was necessary to
take a sub-sample of data points using a
randomised stratified design for the data.
For both yellow and white maize more than
2 000 samples each were selected for the
balanced data sheets.
Integrating GIS software to
present crop quality survey
data
Historically, the data was presented in table
format showing mean values and standard
deviations of results for region and annu-
ally published as such. A new innovative
method had to be developed to see trends
spanning many years, which is not possible
in a table format.
The SAGL, in collaboration with the com-
pany SIQ, explored the possibility of de-
veloping a GIS map system where grain
production regions are presented on a map
of South Africa, with the production region
boundaries illustrated along their specific
co-ordinates. The silo industry assisted
the SAGL and SIQ with the required co-
ordinate data.
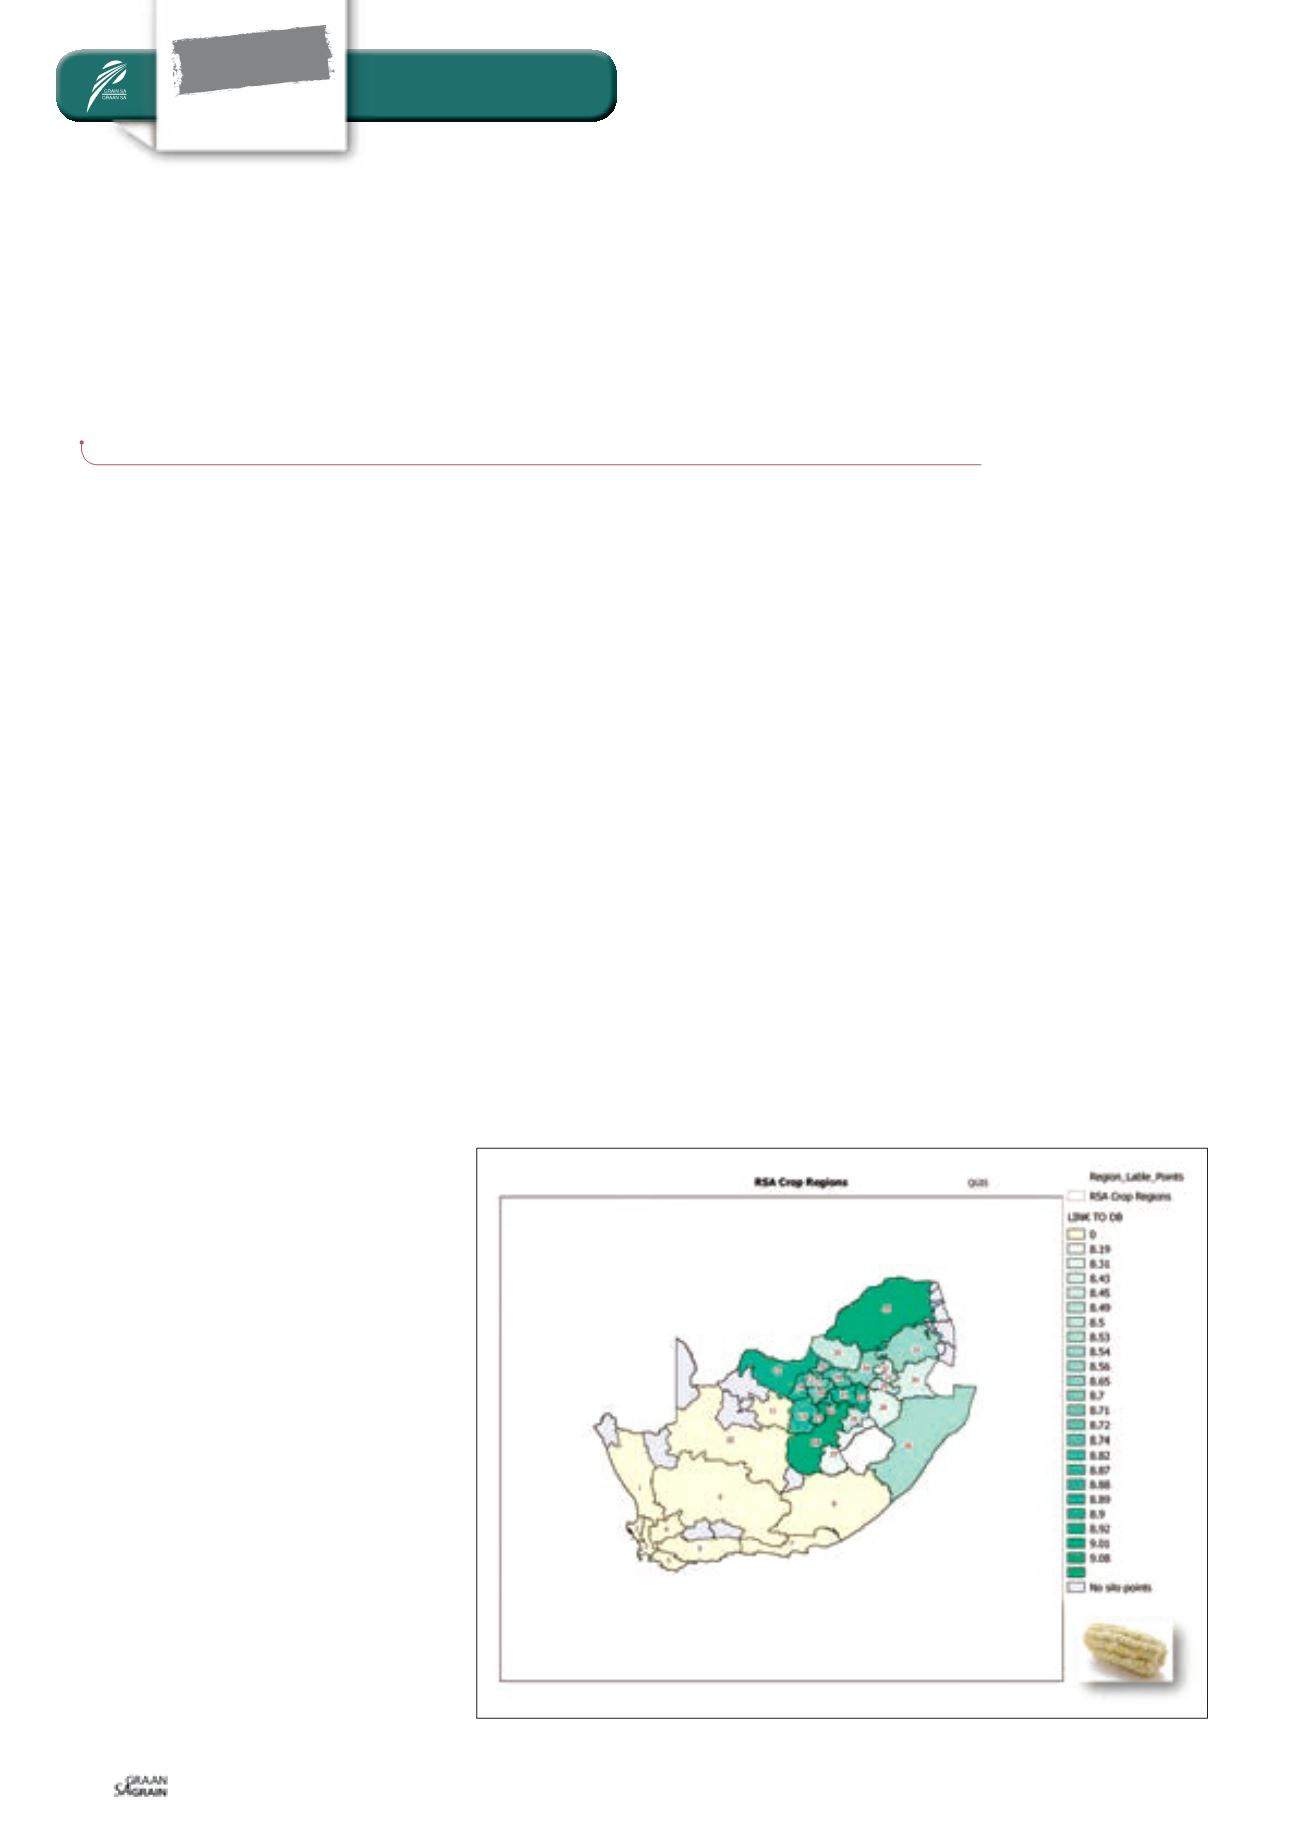
With these maps, the results of the crop
quality traits can then be represented in
Figure 1: Percentage of protein; eleven seasons combined (white maize).
FOCUS
Special
Value adding