


 45 / 84

43
a colour scale format – the highest values
have the darkest colours and the lowest
values, the lightest colours. SIQ created a
custom software package based on an open
source GIS package (QGIS) specifically for
pre-setting crop quality survey data.
The package requires Windows (Access and
Excel) interfaces and is relatively easy to im-
plement. The data from the selected eleven
year period was then analysed further. The
objective was to look for pointers towards
areas where specific traits may be consist-
ently higher or lower than the average when
compared with other areas.
For example, if a specific area always has
the highest protein value irrespective of
the season, it points towards something
unique in that region influencing the value,
and for this a liberal ANOVA test such as
the Fisher LSD test was used on the strati-
fied data set and integrated with the GIS
software. Other statistical tests (parametric
and non-parametric) can also be integrated
if needed.
Trends observed over the
past decade
In the examples shown here we have cho-
sen percentage protein, percentage starch,
hectolitre mass and milling index to illus-
trate the power of the new system. After
completion of the ANOVA test, areas that
were not statistically different from each
other were assigned the same colour.
Figure 1
and
Figure 2
show the map distri-
butions for protein.
Higher protein levels tend to be found in the
western parts of the country. On the other
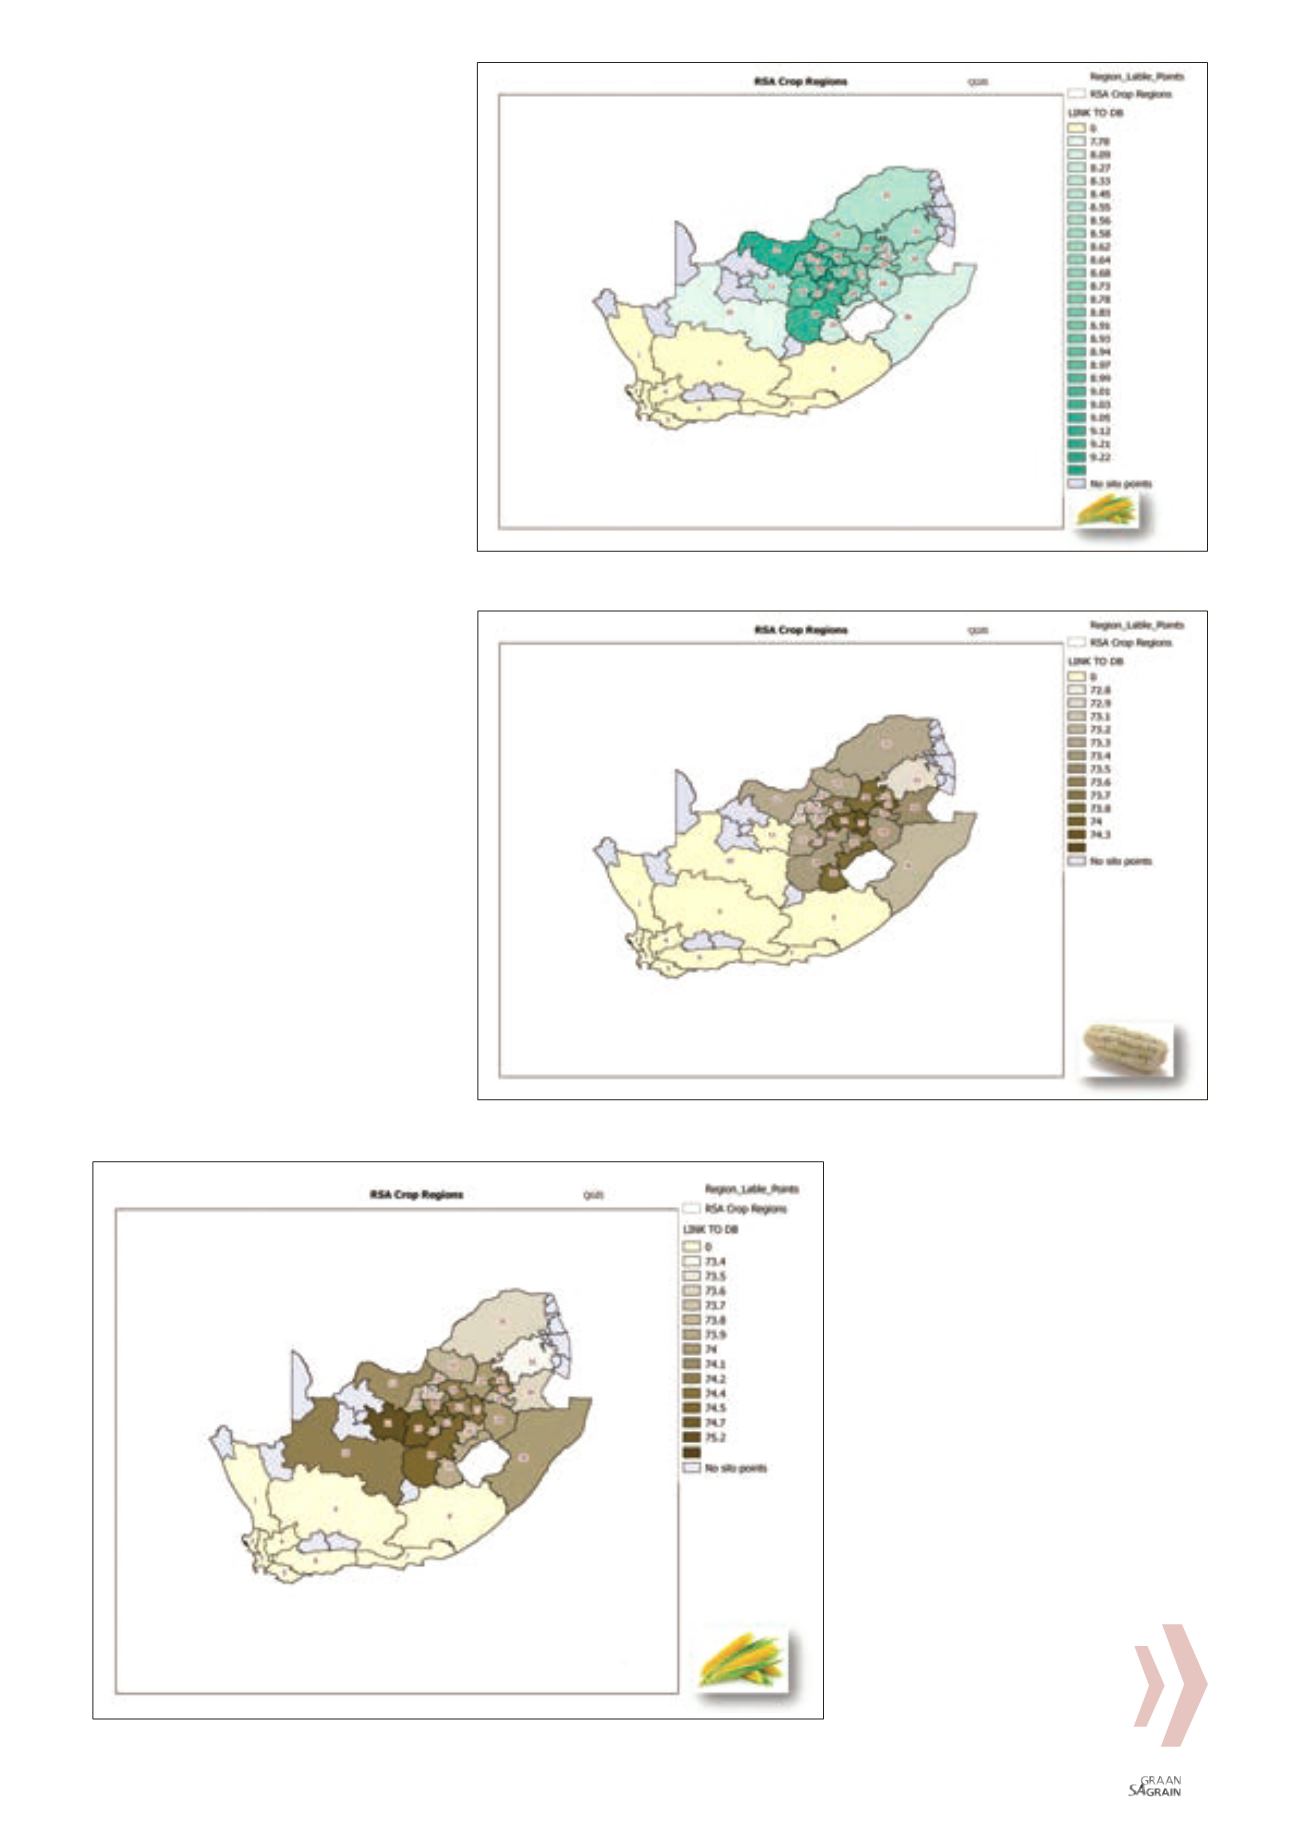
hand, higher starch levels (
Figure 3
and
Figure 4
) can be seen in more of the
central and escarpment regions, as
well as regions where more produc-
tion takes place under irrigation, for
example close to the Gariep dam (regions
11 and 15). Many factors can influence pro-
tein and starch contents in maize, for exam-
ple higher rainfall tends to produce lower
protein levels and more starch.
Soil conditions such as pH and levels of mi-
cronutrients will also have a significant ef-
fect.Hectolitremass(
Figure 5
) ishigher inthe
western parts and milling index (
Figure 6
)
as an indication of milling quality and an im-
portant quality trait for millers, is also higher
in the western areas.
The project is now at a stage where more in-
depth studies are being planned in order to
explain trends observed on a regional level.
These maps will be updated every year and
the objective is to develop a system where
it can be made available online as in-
teractive maps. Similar maps for other
maize quality traits (grading results and
percentage bran) are available for the
same period.
Figure 2: Percentage of protein; eleven seasons combined (yellow maize).
Figure 3: Percentage of starch; eleven seasons combined (white maize).
Figure 4: Percentage of starch; eleven seasons combined (yellow maize).
June 2015