


 50 / 84

Identifying strategic export markets for SA sorghum industry
t
his year, South Africa is confronted by drought and the
country is expected to be a net importer of grains. Nonethe-
less, that does not cease the need to grow export markets
for the South African grain industry, especially since the in-
dustry faces the challenge of high export concentrations in
traditional markets.
The need to grow export markets was widely echoed in several
sorghum specialists’ working group sessions. Hence, this article
will focus on identifying the strategic export markets for the
South African sorghum industry. The analysis will be done using
grain sorghum trade data, HS code 1007. We start by discussing
the trends in South Africa’s sorghum exports, Harmonised System
(HS) product classification for South Africa’s sorghum exports,
explore leading world importers and lastly suggest the strategic ex-
port markets.
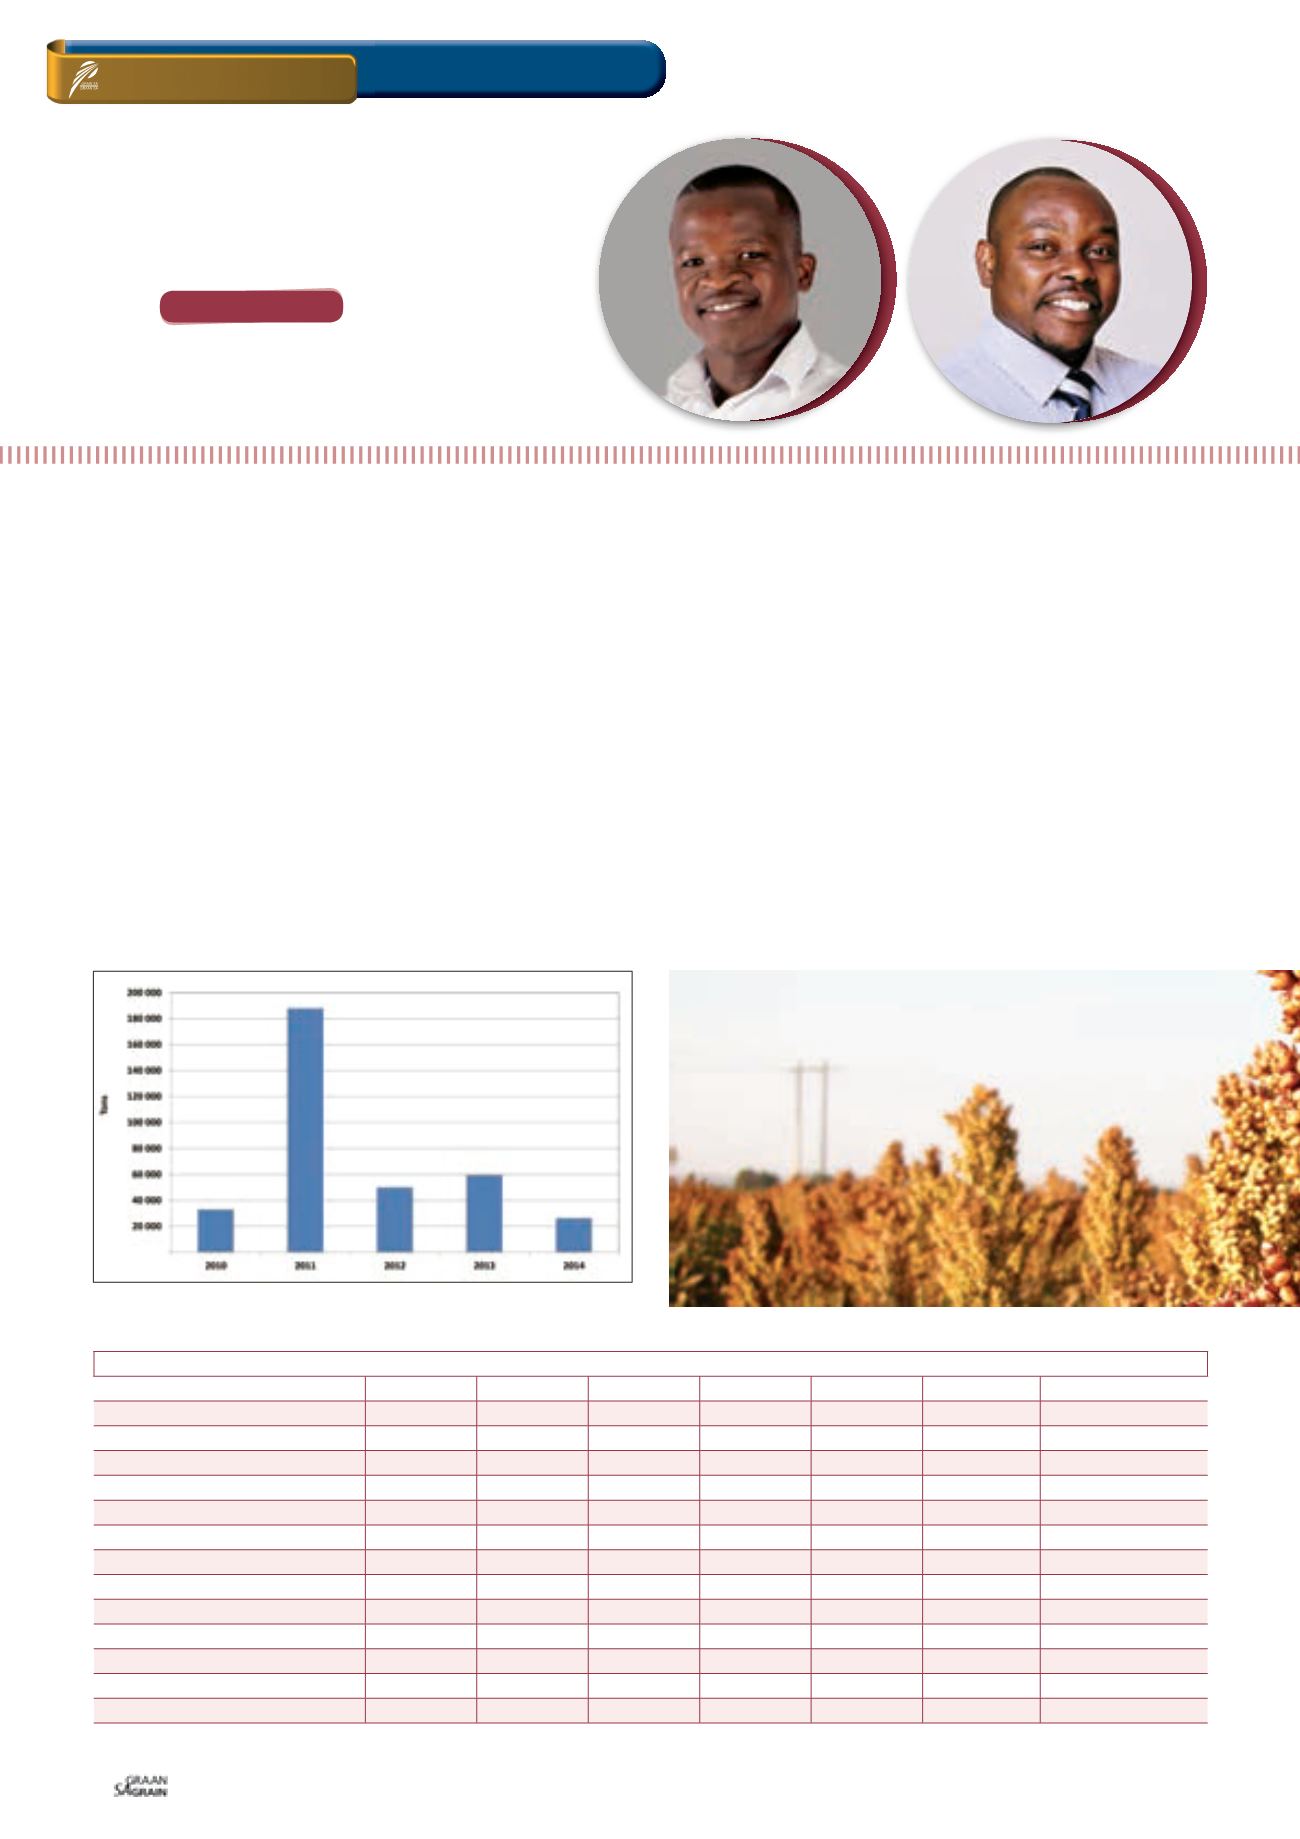
South African sorghum export trends
South Africa’s sorghum exports are generally irregular and incon-
sistent (see
Graph 1
). This lack of consistency can primarily be
attributed to uneven surplus levels and increasing production in tra-
ditional export markets.
Approximately 99% of sorghum is exported by South Africa to
the Southern African Development Community (see
Table 1
). Bot-
swana and Swaziland account for 98% of the South African sor-
ghum exports’ share. The other key export markets within the
continent are Kenya, Uganda and Sudan, which in total account
for 0,5% of South Africa’s export share.
Currently, Botswana’s domestic sorghum production is increasing,
which might limit its import needs in future. International Trade
Centre (2015) data shows that South Africa’s exports’ share in
WANDILE SIHLOBO,
economist: Industry Services, Grain SA
and
TINASHE KAPUYA
,
manager: Trade and Investment, Agbiz
GRAIN MARKET
overview
– 11 May 2015
ON FARM LEVEL
Junie 2015
48
COUNTRY
2010
2011
2012
2013
2014
AVERAGE SHARE OF TOTAL
Botswana
27 223
183 018
46 666
54 660
23 030
66 919
93,70%
Swaziland
2 901
3 814
3 180
4 107
2 255
3 251
4,60%
Uganda
1 204
-
-
-
6
242
0,30%
United Republic of Tanzania
993
-
-
-
2
199
0,30%
Mozambique
65
270
88
295
5
145
0,20%
Zimbabwe
156
36
-
28
493
143
0,20%
Angola
-
260
181
-
173
123
0,20%
Kenya
-
512
-
-
-
102
0,10%
Lesotho
87
31
19
168
12
63
0,10%
Namibia
78
13
1
217
6
63
0,10%
Sudan (North + South)
140
-
-
-
120
52
0,10%
Area not elsewhere specified
-
-
20
35
170
45
0,10%
Total SA exports top markets
32 847
187 954
50 155
59 510
26 272
71 348
-
Total SA exports to the world
33 036
187 968
50 162
59 523
26 330
71 404
-
TABLE 1: SOUTH AFRICA’S OVERALL SORGHUM EXPORTS TO SADC MARKETS (TONS).
Source: International Trade Centre (2015) and own calculations
Graph 1: South Africa’s sorghum exports.
SA Grain/
Sasol Chemicals (Fertiliser) photo competition