


 24 / 48

Januarie 2019
22
ON FARM LEVEL
Conservation agriculture
CARBON EMISSIONS of grain farming
In order to calculate a regionalised carbon
emission profile, the results per commod-
ity were weighted according to the yield per
farming system.
Thereafter these figures were extrapolated
to provide a snapshot winter grain region
carbon emission profile for the current and
future scenarios.
In addition to the regionalised carbon emis-
sions for the current and future farming
scenarios, farming input hotspots were
identified. Hotspots are defined as activi-
ties which contribute the most to the overall
carbon emissions and are therefore catego-
rised as ‘carbon intensive’.
The snapshot carbon emissions per ton
product for the winter grain region currently
and for the future were determined through
a pro-rata allocation of the result to the to-
tal yield per commodity. According to best
available estimates, approximately 90%
of total grain yield (tonnes) in the Western
Cape are currently under CA, while the re-
maining yield is under conventional. With
the calculation of the future scenario it is
predicted that 80% of the total yield will be
under future CA.
Data and inventory
Information from the Crop Estimates Com-
mittee (CEC) was used in order to calculate
the current regional carbon emissions for
each region.
Grain SA sourced existing production prac-
tice data from the different agribusinesses
in the Western Cape. The main partici-
pants who collaborated with production
cost information for the different systems
were Kaap Agri (Swartland), Overberg Agri
(Southern Cape) and SSK (Southern Cape).
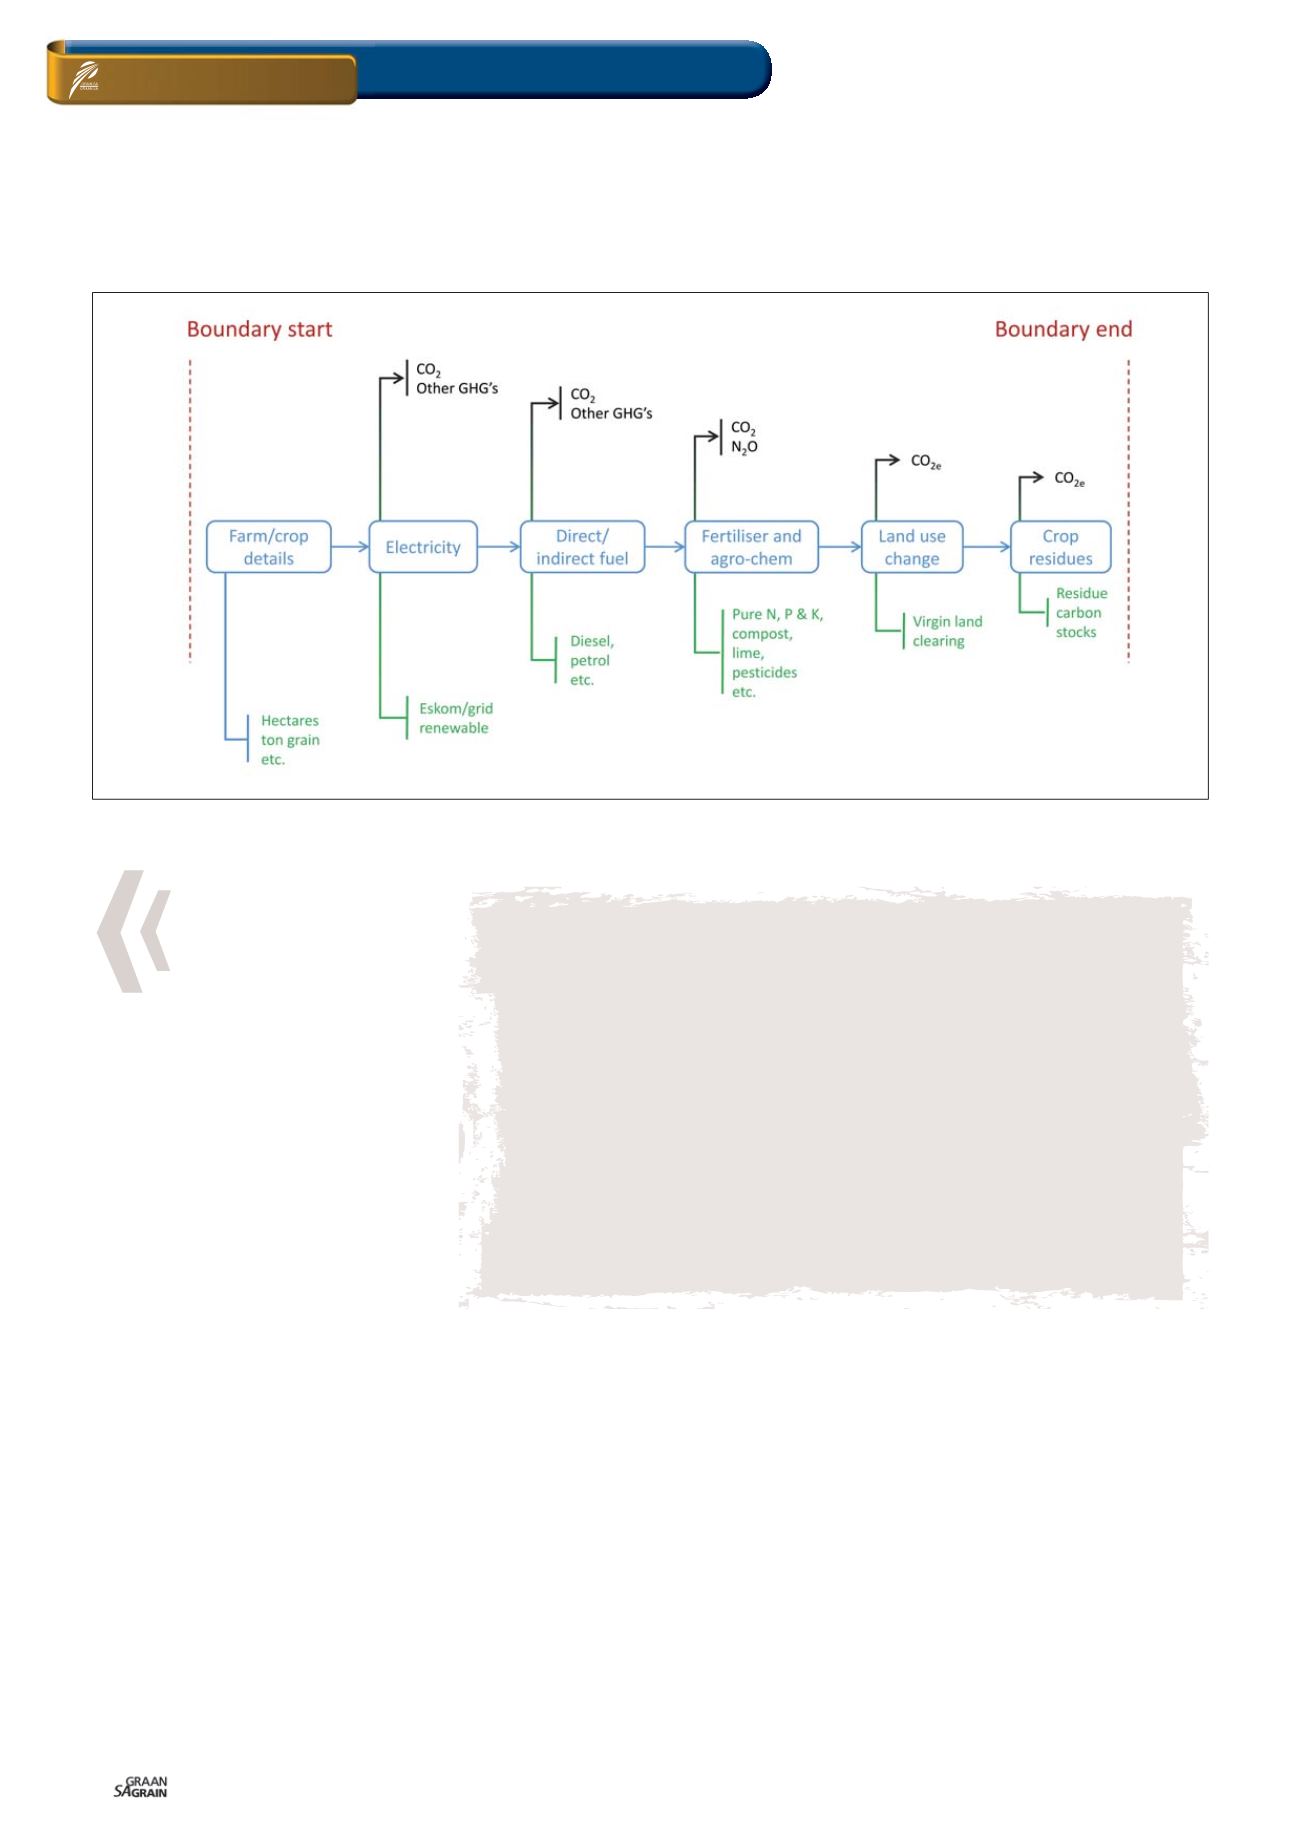
Figure 3
illustrates the data collection pro-
cess with all the different production inputs
collected to calculate the carbon emissions
per ton grain.
In addition to the existing data, Grain SA
had discussions with CA researchers from
the Western Cape (dr Johann Strauss, per-
sonal communication) for making realistic
assumptions regarding production inputs
under an ideal future CA scenario (see
Table 1
on page 21).
Table 2 (
on page 21) illustrates the three dif-
ferent grain farming systems with their crop
rotations in the region. In the conventional
system only, wheat is cultivated each year
while different crops are planted in rotation
with each other in the current CA and future
CA systems. The transition from the CA to
the future CA system sees a change in the
commodities cultivated in the Swartland re-
gions but no change in the Rûens regions.
Results
The results are presented per farming sys-
tem (conventional, current CA and future
CA). In addition to the carbon emissions
per ton grain results, the hotspots for the
current and future scenarios on farms are
presented.
Figure 3: Data collection process map to calculate carbon emissions per ton grain in winter grain regions.
“
“
Fertiliser use is the largest
contributor or hotspot to
total carbon emissions per
hectare followed by lime
and crop residues.