


 30 / 48

Januarie 2019
28
USA farm subsidies:
Lessons to be learnt
T
he World Trade Organisation (WTO)
is an organisation for liberalising
trade among 159 developed and de-
veloping countries across the globe;
it operates a global system for trade rules,
acts as a forum for negotiating trade agree-
ments and settles disputes between mem-
bers.
According to the WTO, there are different
‘boxes’ in which domestic support can be
categorised:
Green (permitted) must not distort trade
or at most cause minimal distortion.
Amber box (slow down – i.e. needs to be
reduced) support measures considered
to distort production and trade.
Blue box for subsidies that are tied to
programmes that limit production.
Brown box for developing countries, al-
lowing additional flexibility in providing
domestic support.
It is just unfortunate that most countries
have reduced the amber box; however, the
green and blue boxes keep growing, there-
fore putting those without any support at a
disadvantage.
The USA is one of the world’s leaders in
grain production, ranked as the first larg-
est producer of maize, producing an annual
average of 360 million tons of maize and
114 million tons of soybeans. As a coun-
try that also gains from export subsidies,
the USA is also ranked as one of the major
exporters of grain, with a wide destination
spanning across developed and least devel-
oped countries.
Over the years, least developed nations
have been hurt by exports that come from
countries that have sufficient government
support. It is against this background that
this article seeks to uncover the underlying
effects of the USA subsidies on developing
countries as well as the benefit that those
producers gain from this range of support.
Agricultural support
according to OECD
Agricultural policies are measures related to
the domestic farm sector and trade in agri-
cultural products. These policies are meant
to address a wide range of issues, includ-
ing providing sufficient food at reasonable
prices for consumers, ensuring food safety
and improving environmental quality.
The Organisation for Economic Co-opera-
tion and Development (OECD) has devel-
oped agriculture support indicators that,
despite this diversity, express policy meas-
ures with numbers in a comparable way
across time and between countries.
Agricultural support is defined as the an-
nual monetary value of gross transfers to
agriculture from consumers and taxpayers,
arising from governments’ policies that sup-
port agriculture, regardless of their objec-
tives and their economic impacts.
The Percentage Total Support Estimate
indicator (%TSE) represents the total of
policy transfers to the agricultural sector
expressed as a share of Gross Domestic
Product (GDP). The Percentage Producer
Support Estimate (%PSE) represents policy
transfers to agricultural producers, meas-
ured at the farm gate and expressed as a
share of gross farm receipts.
Total Support Estimate transfers consist
of transfers to agricultural producers
ON FARM LEVEL
Agricultural support / Advantage / Trade relations
Farm subsidies
IKAGENG MALULEKE,
junior economist, Grain SA
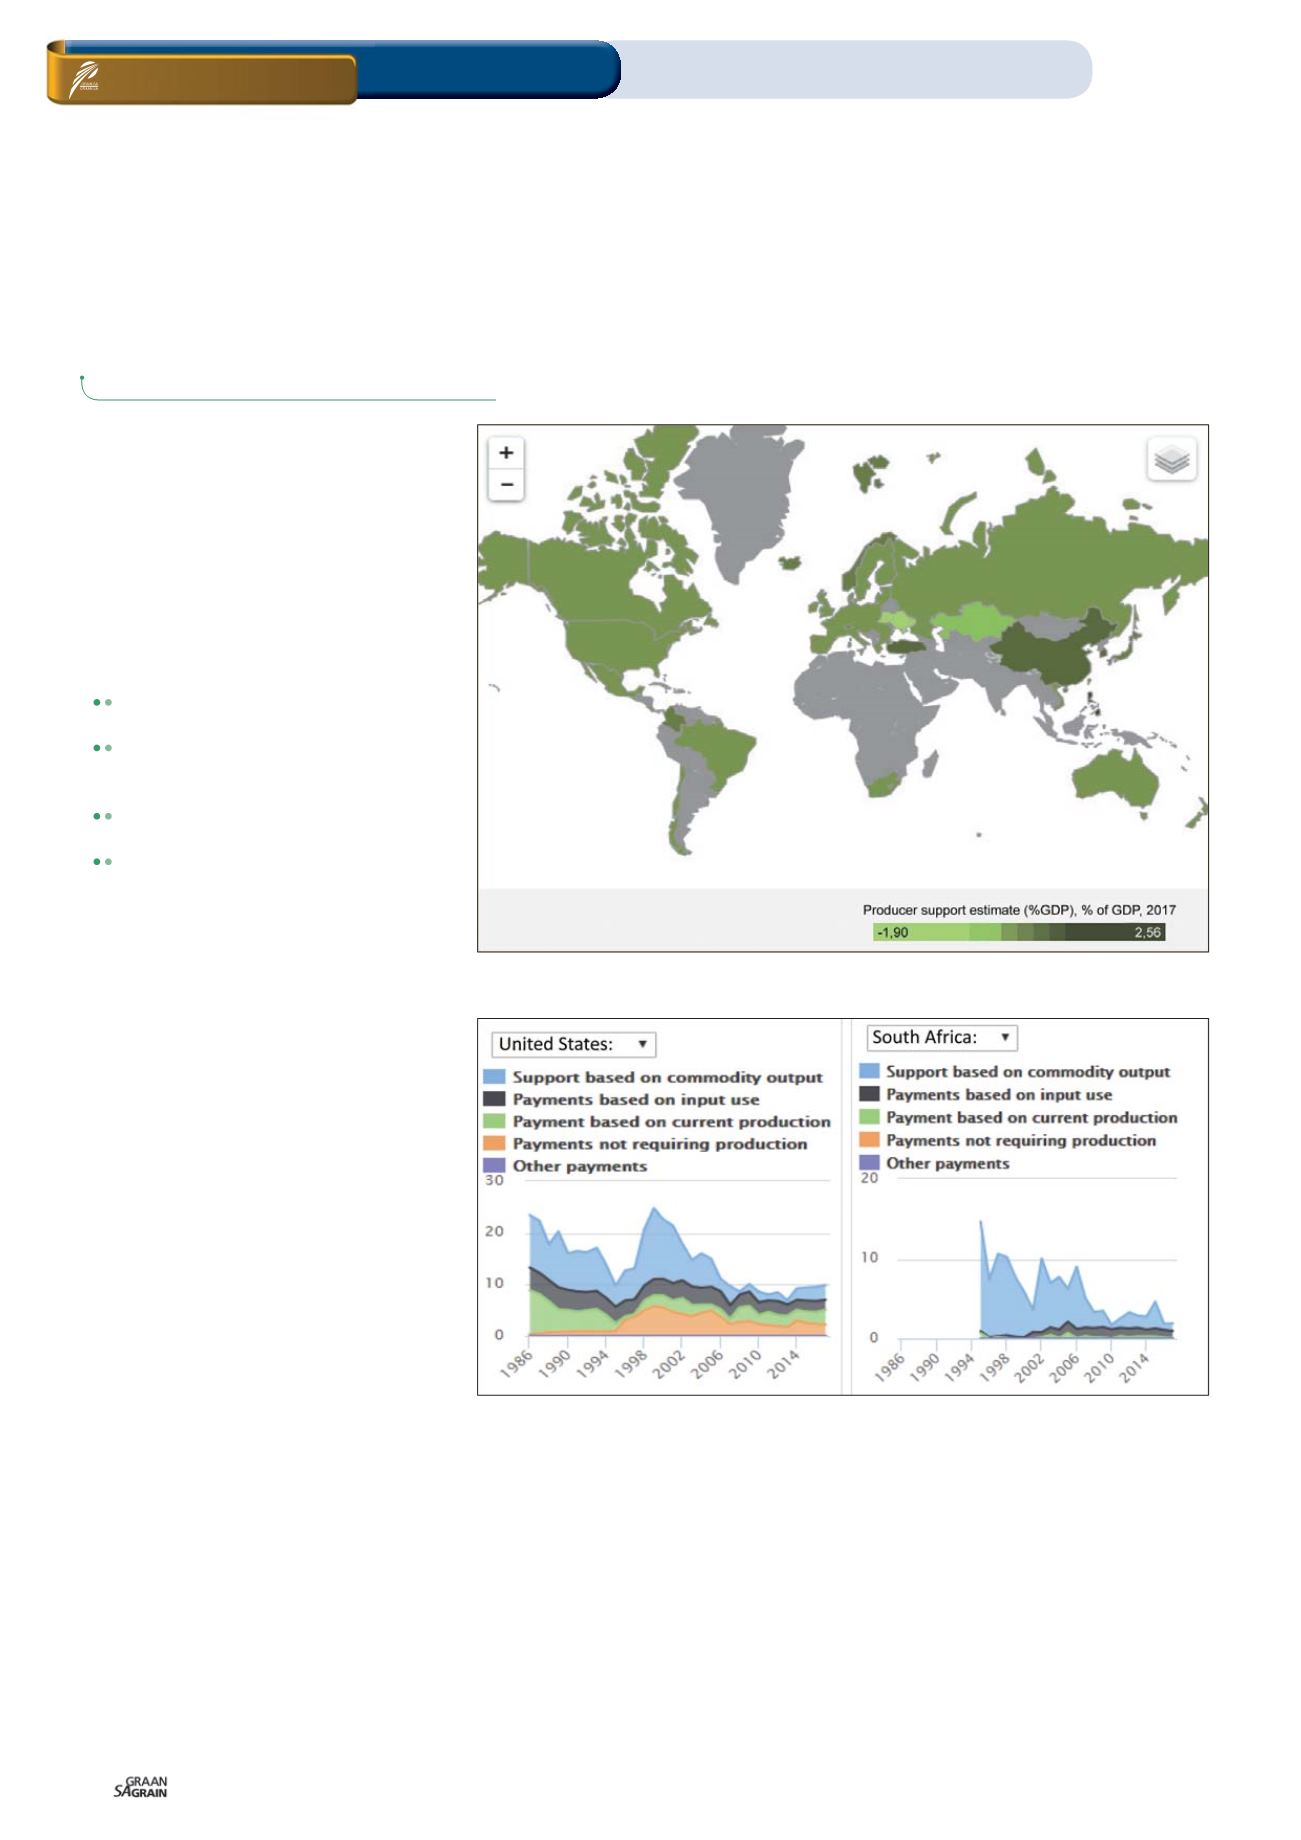
Figure 1: Producer support estimate as percentage of GDP across the globe.
Source: OECD, 2017
Figure 2: PSE support structure for the USA compared to South Africa.
Source: OECD, 2017