


 98 / 116

Oktober 2018
96
wheat quality
scrutinised
W
heat contributed 79% to the
total winter cereal crop produc
tion in South Africa during the
2017/2018 production season.
The Southern African Grain Laboratory
(SAGL) received and analysed 304 samples
to provide as best possible a proportional
representation of the production of wheat
in all the different production regions.
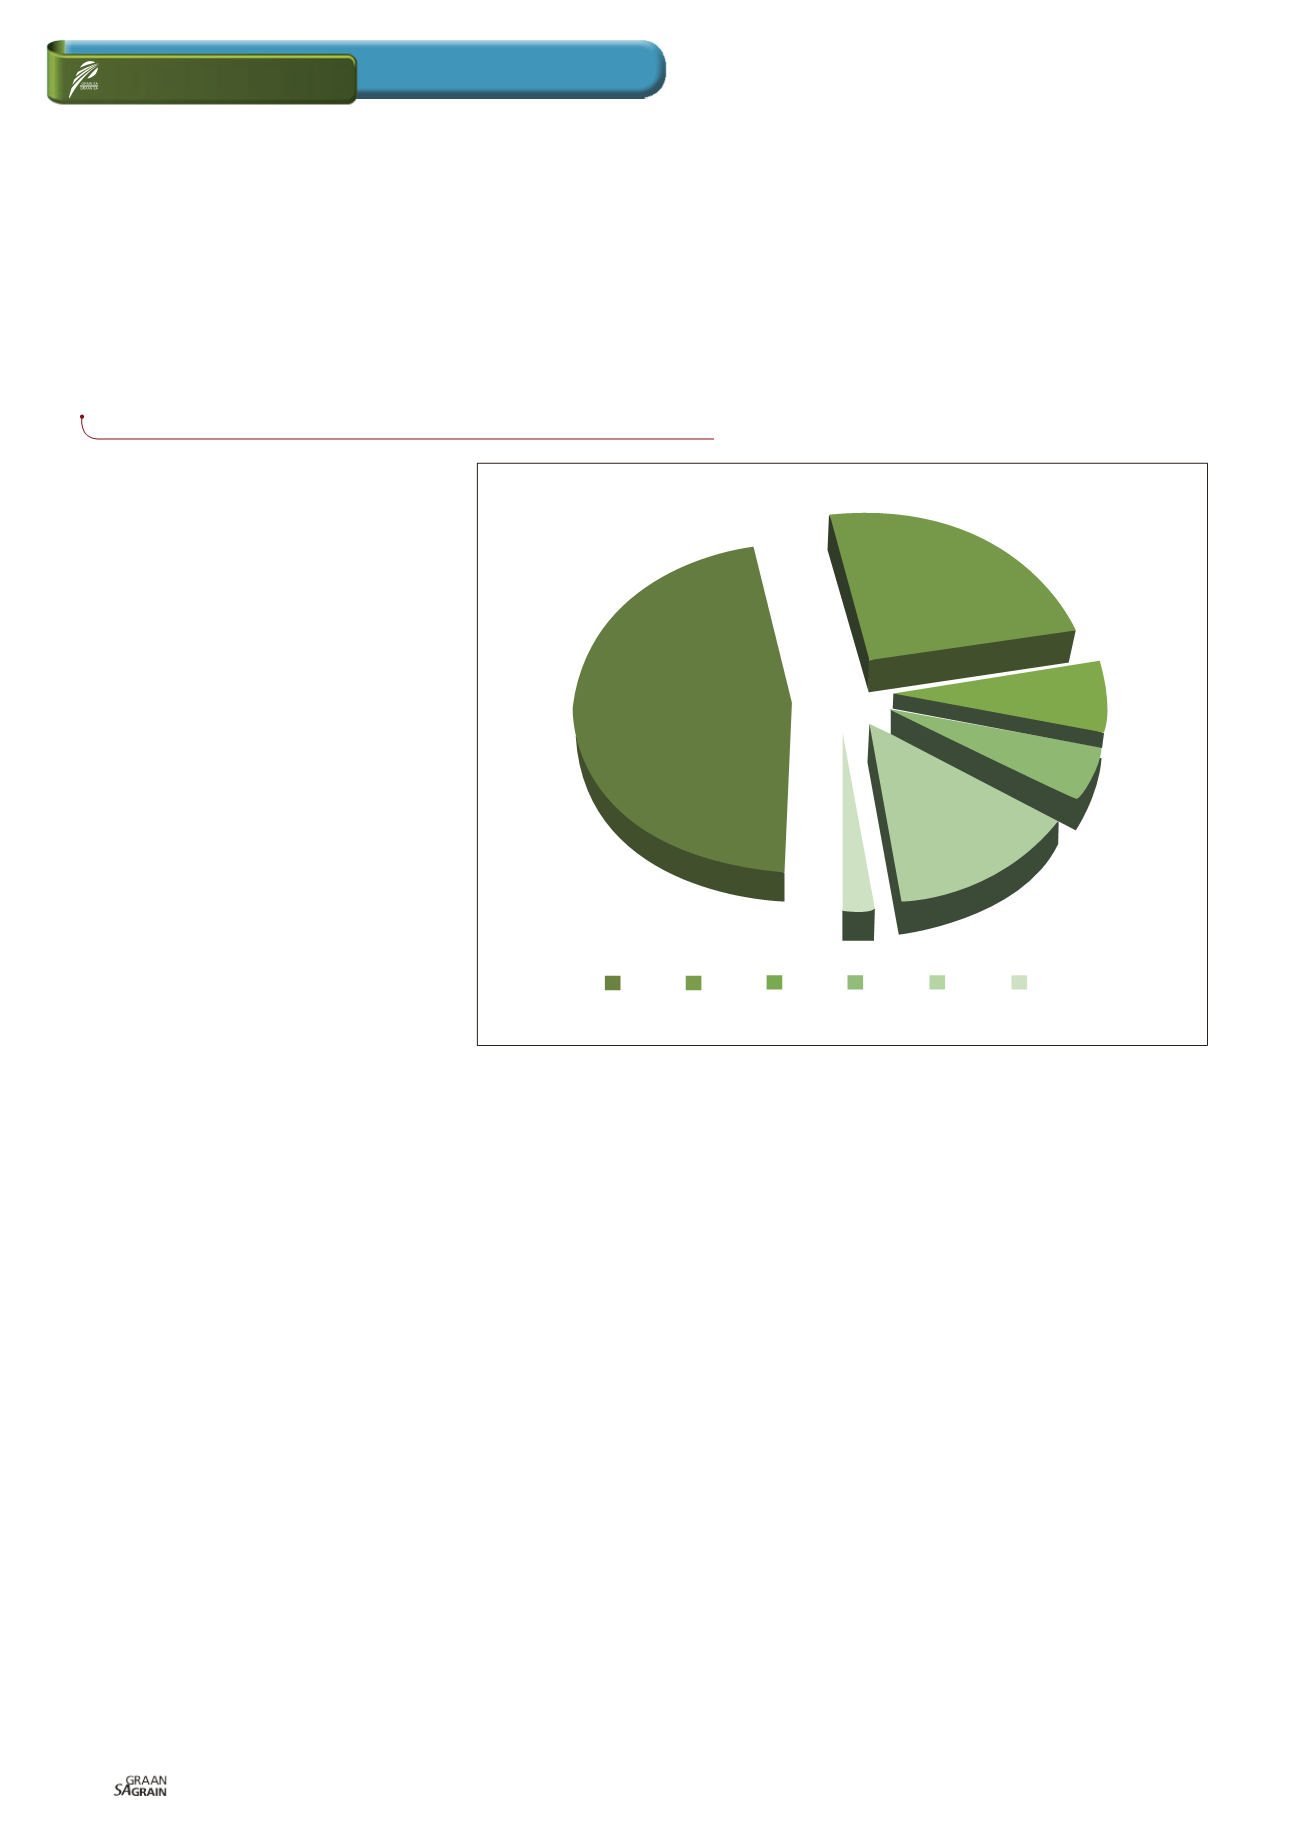
See
Graph 1
for the percentage of sam
ples graded per class and grade during this
season.
The majority of the samples (71%) down
graded to utility grade was as a result of
either the percentage screenings or mainly
other grain and unthreshed ears, individu
ally, or in combination with the combined
deviations, exceeding the maximum allow
able level for grades B1 to B4. Most of these
downgraded samples originated from the
Western Cape.
Grade B1 wheat in the Free State amounted
to 51% (71% in the previous season). In the
irrigation areas 43% (52% in the previous
season) of the wheat was graded as B1 and
in the Western Cape 48% was graded as B1
(22% in the previous season).
The national whole wheat protein average
increased from 12% in the previous season
to 12,6%. The ten-year national average is
11,9%. This is the second highest average
since the 2004/2005 season and can be at
tributed to the above average protein values
observed in the winter rainfall area of the
Western Cape where severe drought condi
tions were experienced.
The winter rainfall area reported its high
est protein average of 13,2% since the
start of this annual survey 20 years ago.
The irrigation areas averaged 11,9% and
the production regions in the Free State
12,6%. The percentage of samples having
protein contents higher than 12% increased
from 47,8% last season to 63,5%. During
the 2015/2016 season this percentage was
68,2%. The protein content is reported on
a 12% moisture basis.
Nationally the average hectolitre mass
was 80,7 kg/hl, slightly lower than the
81,5 kg/hl of the 2016/2017 season. This val
ue also compares very well with the eight-
year weighted average of 80,6 kg/hl for
determinations done by means of the
Kern 222 instrument.
Of the 31 samples that reported values be
low the 77 kg/hl minimum level for grade B1
wheat, 26 originated in the Western Cape
(as can be expected due to the drought),
while the remaining five samples originated
in the Free State production regions. The
regional averages ranged from 79,1 kg/hl in
the Western Cape to 83,2 kg/hl in the irriga
tion areas.
The 1 000 kernel mass, reported on a 13%
moisture basis, decreased from 38,6 g
last season to 37,7 g this season. The
2015/2016 season’s average was 36,8 g.
Averages over production areas varied from
36,2 g in the Western Cape to 39,6 g in the
irrigation areas.
The weighted average percentage screen
ings obtained with a 1,8 mm slotted sieve
was 1,51%, 0,35% lower than the previous
season and also the lowest value in the past
five seasons. The winter rainfall area report
ed the highest average percentage, namely
1,79% and the irrigation areas the lowest of
1,05%. 28 of the 304 samples exceeded the
3% maximum permissible screenings level
for grade B3 and of these eleven exceed
ed the 4% maximum permissible level for
grade B4. Most of these samples originated
in the Western Cape.
This season the average falling number was
371 sec. Five of the samples analysed gave
falling number values below 250 sec and
of these, four were below 220 sec. All but
one of these samples originated in the Free
State area, the other sample in the Western
Cape. The highest average falling number
value of 385 sec, was reported for the irri
gation areas. The results of this, as well as
previous surveys, provide evidence that low
falling number values are generally not a
problem experienced in South Africa.
See
Table 1
for a comparison of the aver
age quality results of local wheat over the
past four seasons. It is interesting to note
that the average values of the 2017/2018
and 2015/2016 seasons’ farinograph,
alveograph and extensograph results are
almost identical, while the 2016/2017 and
Relevant
Jolanda Nortjé,
manager: Laboratory, Southern African Grain Laboratory NPC
Graph 1: Percentage of samples per class and grade in the 2017/2018 season.
14%
47%
B1 B2 B3 B4 UT COW
25%
7%
5%
2%