


 101 / 116

Local and
imported
wheat quality
The area utilised for wheat production
decreased by 3,3% to 491 600 ha from
508 365 ha in the previous season. The al
most 51% decline in dryland area planted
in the Free State, were off-set by a 56% in
crease in irrigation area planted and a 35%
total yield increase. Nationally, dry land
area decreased by 9,7% year on year and
irrigation area increased by close to 22%
year on year.
In the main production areas the yield
ranged from 1,80 t/ha in the winter rainfall
area of the Western Cape to 4,20 t/ha in the
Free State (summer rainfall and irrigation)
to 8,20 t/ha for irrigation wheat produced in
the Northern Cape. The national yield aver
age decreased from 3,76 t/ha in the previ
ous season to 3,12 t/ha. The drought in the
Western Cape was the main contributor to
this decrease in yield. (Figures obtained
from the Crop Estimates Committee [CEC]).
Imported wheat
South Africa is a net importer of wheat and
relies on imports to supply local demand.
Demand for wheat processing (human, ani
mal and gristing) was fairly stable over the
past four seasons, varying 63 116 tons be
tween the highest and lowest.
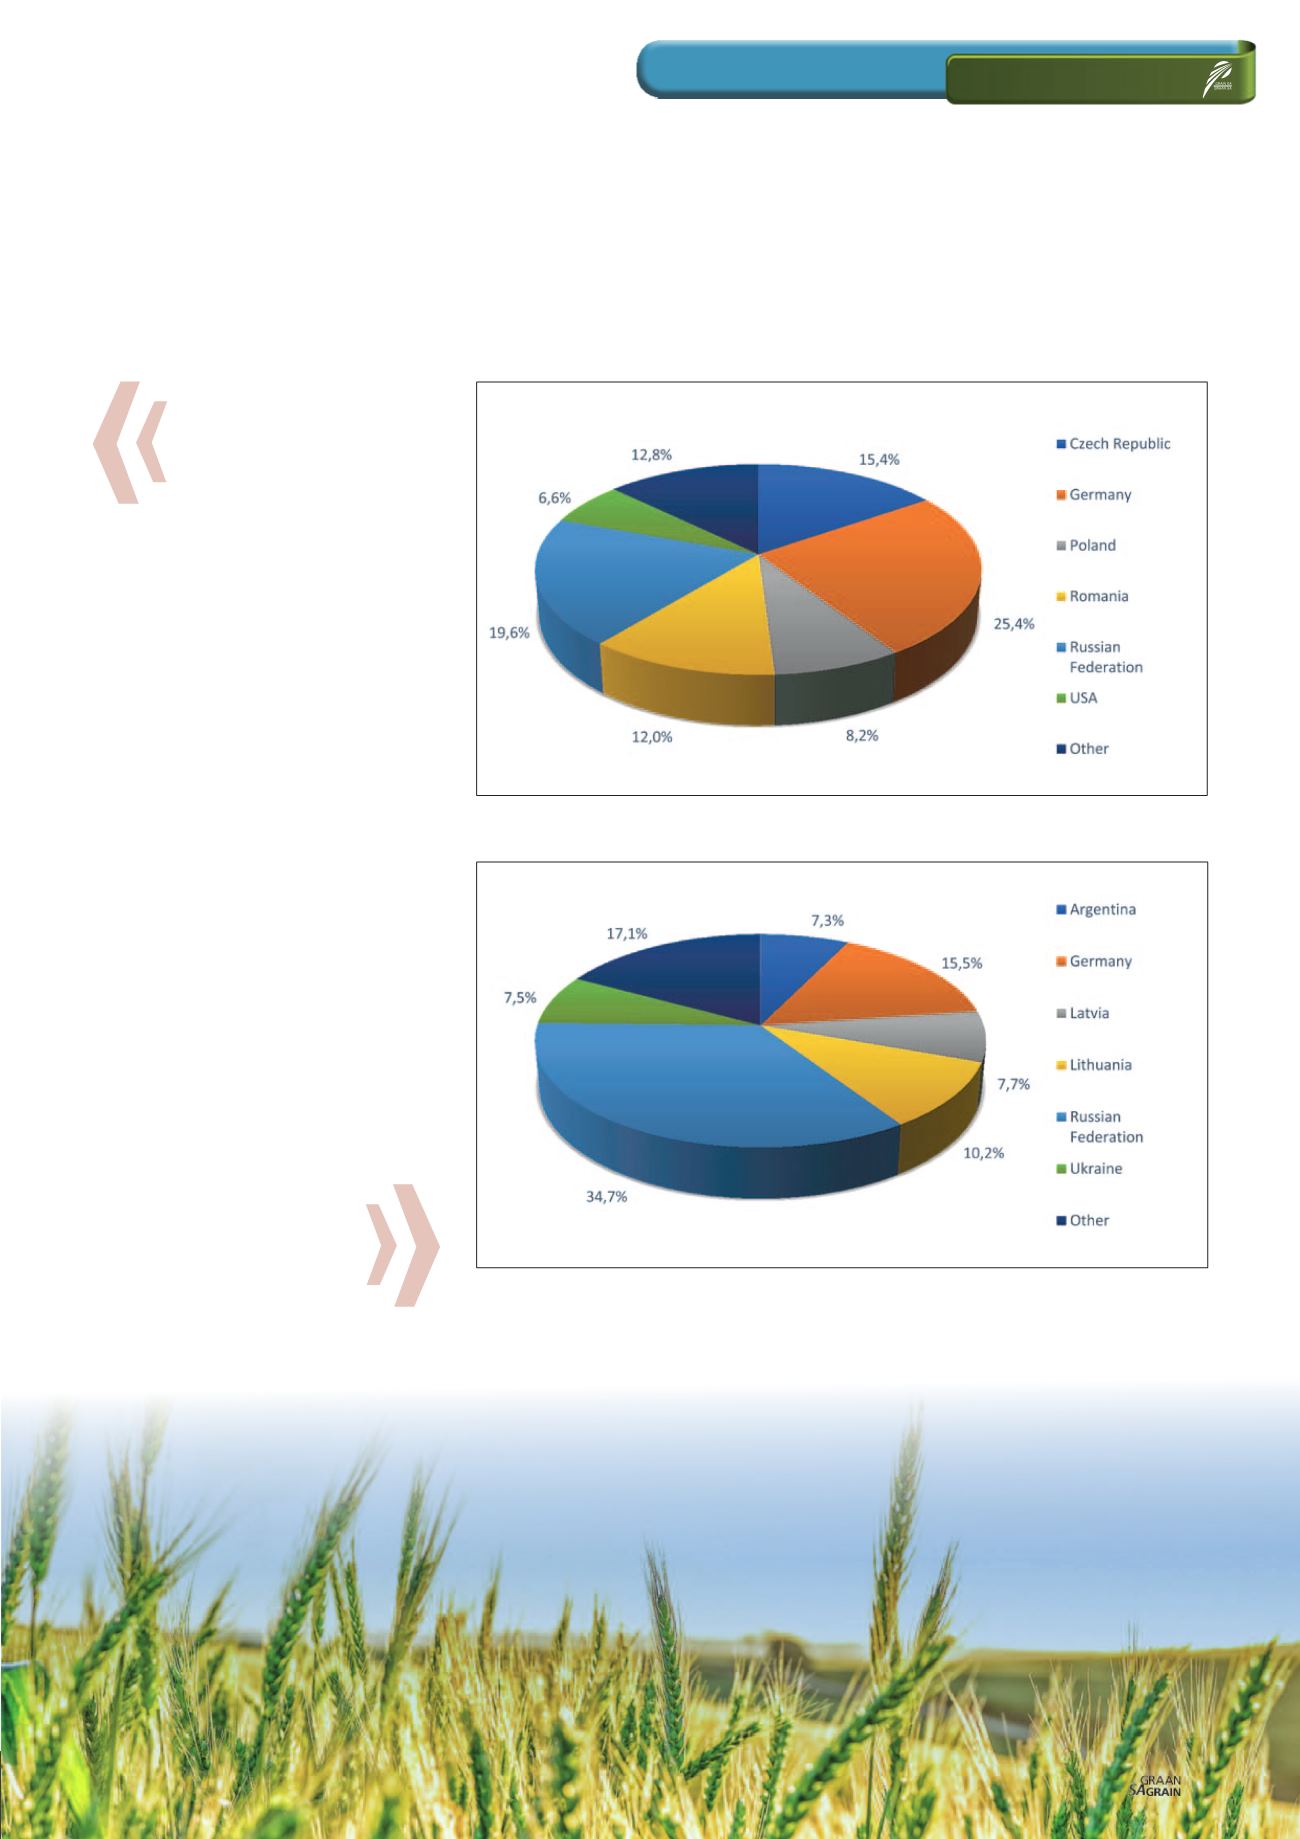
During the 2016/2017 season 934 765 tons
of wheat were imported for local use. This
figure constitutes an almost 55% decrease
compared to the severe drought stricken
2015/2016 season. A quarter (237 508 tons)
of the total amount of wheat imported dur
ing the 2016/2017 season, originated in Ger
many, followed by 182 993 tons from the
Russian Federation and 144 402 tons from
the Czech Republic.
Graph 2: Wheat imports per origin for domestic use 2016/2017 season.
Graph 3: Wheat imports per origin for domestic use 2017/2018 season.
* Include imports up to 10 August 2018
relevant
99
October 2018
Grain SA/Sasol photo competition