


 99 / 116

97
October 2018
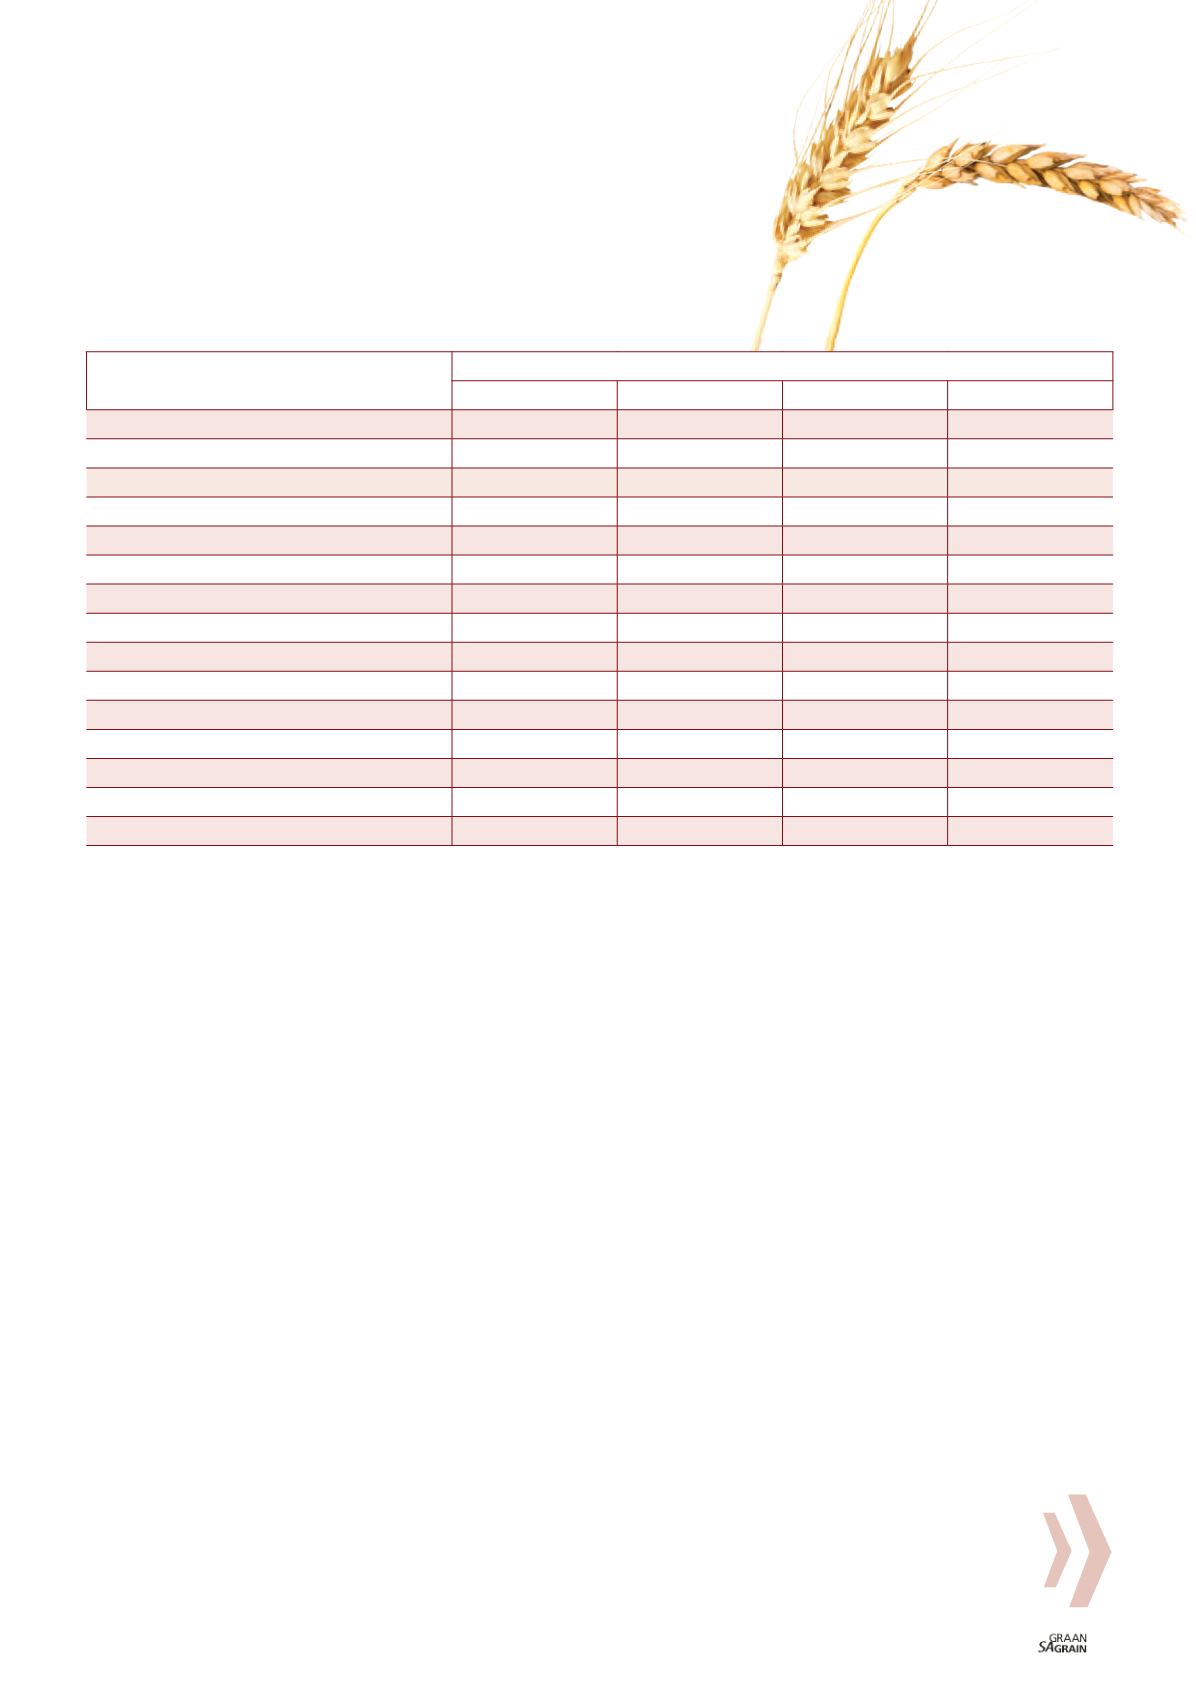
2014/2015 results are very similar. A de
crease in the alveogram distensibility with
a resulting increase in the P/L value, is indic
ative of a more elastic dough. The P/L value
is obtained by dividing the stability value (P)
by the distensibility value (L).
Mycotoxins
Mycotoxins, toxic chemical compounds
produced by moulds, can contaminate com
modities either in the field or during storage
and are invisible, odourless and tasteless.
Mycotoxin production is foremost a food
safety issue, although the occurrence of
moulds can also lead to damage ranging
from rancidity, odour, flavour changes, loss
of nutrients and germ layer destruction re
sulting in a reduction in quality. Most myco
toxins are toxic in very low concentrations
so this requires sensitive and reliable meth
ods for their detection.
According to the Food and Agriculture Or
ganization, food losses due to mycotoxin
contamination are estimated at 25% on a
global scale and pose a real threat to food
security, especially in Africa where the
magnitude of losses is difficult to estimate
because of a lack of information. Effective
management to prevent food losses or ad
verse health effects as a result of long-term
exposure to contaminated food is only pos
sible when adequate reliable testing data
is available. Well-timed interventions in
the food and feed value chain can then be
based on these testing results.
The accredited multi-mycotoxin assess
ments included in the annual wheat crop
quality survey for the past eight seasons,
provide the most comprehensive overview
of the multi-mycotoxin risk in commercial
wheat produced and delivered to commer
cial grain storage companies in South Af
rica. 40 wheat samples, randomly selected
to represent different regions as well as
grades, are analysed annually.
An absence of Aflatoxin B
1
, B
2
, G
1
, G
2
, Fu
monisin B
1
, B
2
, B
3
, Ochratoxin A, Zearale
none, T2-toxin and HT-2 toxin in the wheat
samples over the past seven seasons were
confirmed in the 2017/2018 season. The
samples that did test positive for Deoxyni
valenol (DON) residues this season, were
all well below national and international
maximum residue levels, as was the case in
previous seasons. The average value of the
seven positive results was 202 µg/kg (ppb)
and the highest value obtained 570 µg/kg.
Last season, four samples tested positive
for DON residues with an average value of
289 µg/kg (ppb), the highest value obtained
was 501 µg/kg.
Constant monitoring and continued re
search on the prevention and mitigation of
mycotoxin contamination are necessary.
Application of good agricultural practices
and storage conditions as well as effective
mycotoxin risk management programmes
are essential elements in preventing the
negative effects of mycotoxins.
Production overview
The commercial wheat crop of the 2017/
2018 season was set at 1,535 million tons,
which is 375 000 tons (19,6%) lower than the
previous season’s crop and also 16% lower
than the ten-year production average of
1 826 800 tons (2007/2008 to 2016/2017
seasons). A total area of 491 600 ha was uti
lised for wheat production and the average
yield was 3,12 t/ha.
A severely drought stricken Western Cape
produced 586 800 tons of wheat this sea
son, contributing 38,2% of the total crop,
compared to the 57,5% of the previous
season. The Free State’s wheat production
(336 000 tons) was the highest of the past
five seasons. This figure was also the sec
ond highest nationally. The irrigation ar
eas of the Northern Cape, the third largest
wheat producing area this season, pro
duced 311 650 tons, 45 650 tons more than
last season. The remainder of the wheat
was produced mainly in Limpopo with
132 000 tons, representing an increase of
27% compared to the 2016/2017 season and
North West Province, where production in
creased by 20% to 83 700 tons.
Quality parameter
Season
2017/2018
2016/2017
2015/2016
2014/2015
Flour protein (12% mb), %
11,3
11,2
11,8
10,7
*Konica Minolta colour, L*
93,78
93,71
93,78
93,77
*Konica Minolta colour, b*
9,84
10,12
9,75
9,72
Wet gluten (14% mb), %
30,7
30,7
31,9
28,9
Dry gluten (14% mb), %
10,4
10,5
11,0
9,8
Farinogram absorption (14% mb), %
60,3
60,1
60,8
59,5
Farinogram development time, min
5,5
5,2
5,8
5,3
Farinogram stability, min
8,0
8,3
8,0
8,3
Alveogram strength, cm
2
39,2
37,0
38,3
38,1
Alveogram stability, mm
83
73
81
75
Alveogram distensibility, mm
115
135
115
133
Alveogram P/L
0,81
0,57
0,75
0,59
Extensogram strength, cm
2
106
99
105
98
Mixogram peak time, min
2,6
2,6
2,6
2,7
Bread volume 100 g, cm
3
1 096
1 040
1 047
889
* CIELAB L*a*b*
Table 1: Average quality of local wheat over four seasons.