


 102 / 116

Monsanto is ’n geregistreerde handelsnaam van Monsanto Technology LLC. Monsanto Suid-Afrika (Edms) Bpk, Posbus 69933, Bryanston, 2021.
Besoek ons verwysingshulpbronne
op sosiale media.
Tel:
011 790-8200
customercare.sa@monsanto.com
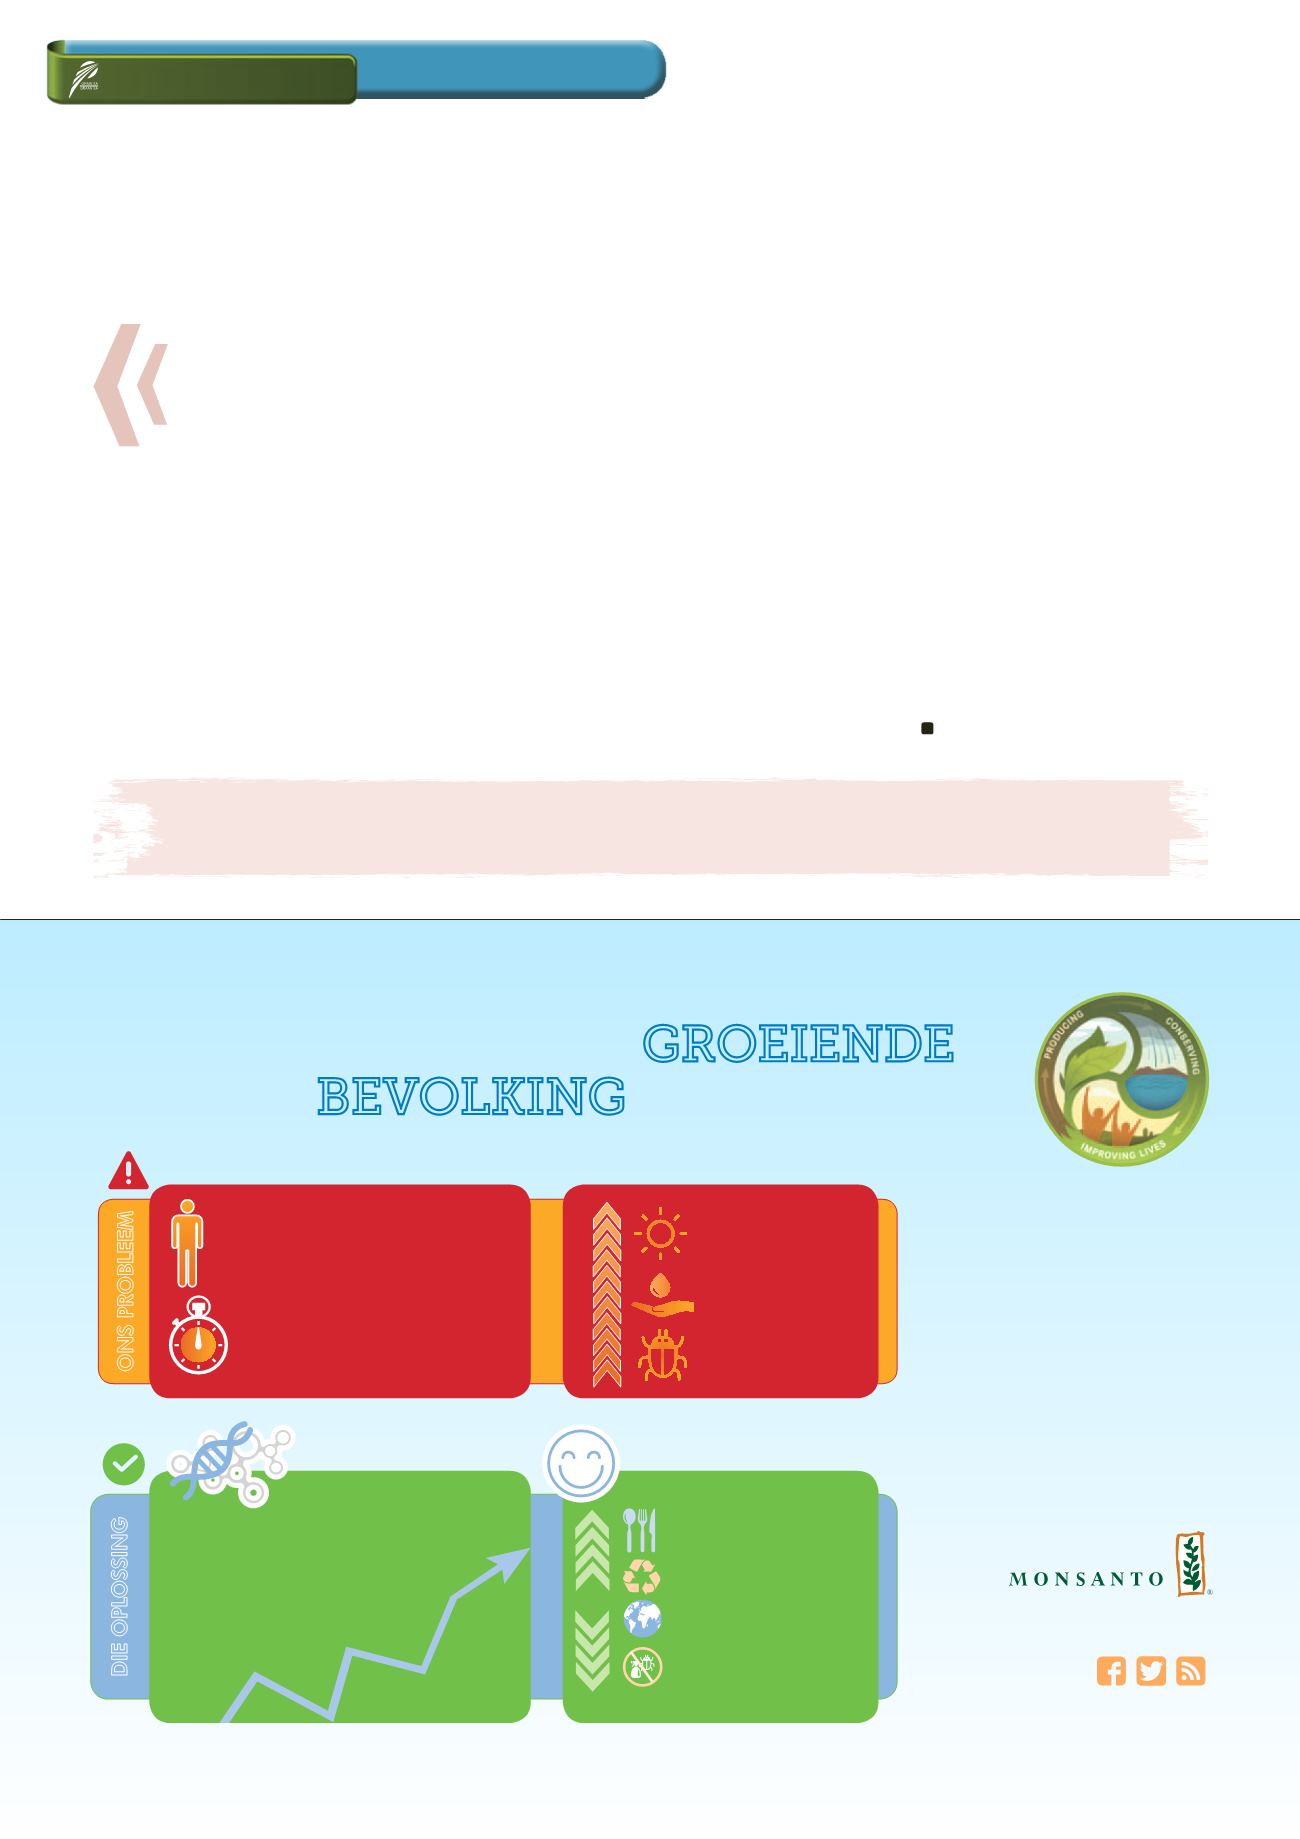
DIT IS HOE ONS ’N GROEIENDE
BEVOLKING GAAN VOED
20 jaar van produksie
op meer as 2,5 miljard
hektaar wêreldwyd
GEEN NADELIGE GEVOLGE
GEDOKUMENTEER
VOEDSELPRODUKSIEBEDREIGING
VINNIGE BEVOLKINGSGROEI
ONS PROBLEEM
Klimaatsverandering
Beperkte en krimpende
hulpbronne
Plae
DIE OPLOSSING
GM-GEWASSE
Plantvariëteite wat die volgende bied:
• Groter oes
• Doeltreffender gebruik van hulpbronne
• Insekverdraagsaamheid
• Onkruiddoderverdraagsaamheid
• Groter biodiversiteit
• Verhoogde opbrengs
Beter saad help boere om
meer te
produseer, terwyl hul minder gebruik
WAT KRY JY?
Voordele van GM-gewasse:
Verhoogde
voedselsekerheid
Verminderde
kweekhuisgasse
Afname
in plaag- en
onkruiddodergebruik
GENOEG GESONDE VOEDSEL
Verhoogde
volhoubaarheid
https://populationpyramid.net/south-africa/2025/
https://www.statssa.gov.za/publications/P0302/P03022015.pdf
Globaal in 2016 het 18 miljoen boere in
26 lande 185,1 miljoen hektaar
GM-gewasse geplant. (ISAAA.2016).
Sedert 1996 is die gebruik van
plaagdoders met 581.4 kg aktiewe
bestanddeel verminder en die
omgewingsimpak gemeet deur die
omgewingsimpak-kwosiënt (EIK-)aanwyser,
het met 18.5% gedaal. (Brookes & Barfoot)
Teen
2025
sal daar
4 MILJOEN
meer monde wees om te voed.
Dit is
7 MILJOEN
meer as
2010
.
3427
babas word elke dag gebore,
dit is
3
meer monde om te voed elke minuut.
A18737
A total number of 93 samples of wheat im
ported from eleven countries were received
for analysis. Wheat imported for purposes
other than bread baking (e.g. soft types for
biscuit making) is included.
18% of the samples had hectolitre mass
values below 77 kg/hl, compared to the 7%
and 3% of the previous two seasons. These
samples originated from the Russian Feder
ation, Poland and the Ukraine, which report
ed the lowest hectolitre mass values overall.
None of the imported samples reported fall
ing number results below 220 sec. As in the
previous three seasons, the wheat import
ed from Australia had the highest falling
number value.
The imported Canadian wheat again had
the highest protein content resulting in the
highest gluten content. In general, the im
ported wheat had lower farinograph water
absorption values and shorter develop
ment times than local wheat. Alveograph
strengths tended to be lower and the dis
tensibility values shorter. Most of these
samples again showed a tendency towards
longer mixogram mixing times.
Composite samples of holds per shipment
per country were tested for the presence
of mycotoxin residues by means of a multi-
mycotoxin analysis. The mycotoxin results
did not raise any concerns. Deoxynivalenol
(DON) residues were observed on some
of the samples, but none of the levels ex
ceeded national or international maximum
residue levels.
The amount of wheat imported for local
consumption so far during the current sea
son (up to 10 August 2018), amounts to
1 815 759 tons according to SAGIS. Almost
35% of this wheat originated in the Rus
sian Federation. The analysis of 151 sam
ples have been completed to date. Similar
quality and mycotoxin trends as mentioned
above for the 2016/2017 season, are ob
served on these imported wheat samples.
Visit our website,
www.sagl.co.za
, for de
tailed results on local as well as imported
wheat quality surveys. The crop qual
ity reports can also be downloaded in PDF
format.
Our sincere appreciation to the Winter Cereal Trust for financial support of this annual survey, to Agbiz Grain
members for providing the crop samples, as well as DAFF inspectors at the harbours for providing representative
samples of each shipment of imported wheat.
Local and
i ported
wheat quality
Relevant