


 71 / 108

T
he 2016/2017 soybean crop quality
survey is the sixth annual survey
performed by the Southern Afri-
can Grain Laboratory (SAGL). The
goal of this survey is to compile a detailed
database, by accumulating quality data
collected from the national commercial
soybean crop over several seasons.
This essential data set is a valuable tool, as-
sisting industry with decision making pro-
cesses. General tendencies are revealed
and quality differences highlighted in the
commercial soybean produced in different
local production regions.
Quality analyses, which included grading,
were performed on 150 composite samples.
These composite samples, representing
each delivery of soybeans at the various
silos throughout the soybean production
regions, were taken according to the pre-
scribed grading regulations, during the
2017 harvesting season.
The majority of soybeans produced in
South Africa is genetically modified (GM),
with an estimated 95% of the area planted
to soybeans in South Africa being GM.
Worldwide, GM soybeans occupy 80% of
the area planted to soybeans.
SAGL screened 15 of the crop samples
to test for the presence of CP4 EPSPS
(Roundup Ready
®
). The EnviroLogix Quick-
Comb kit for bulk soybeans was used to
quantitatively determine the presence of
genetically modified soybeans. The kit is
designed to extract and detect the pres-
ence of certain proteins at the levels typi-
cally expressed in genetically modified bulk
soybeans. Results were scanned and inter-
preted quantitatively with the EnviroLogix
QuickScan system. All the samples tested
positive for the presence of CP4 EPSPS.
Grading was done in accordance with the
regulations related to the grading, packing
and marking of soybeans intended for sale
in South Africa (No. R 370 of 21 April 2017).
85% (132) of the 150 samples were graded
as Grade SB1, with 18 (15%) of the sam-
ples downgraded to class other soybeans
(COSB). During the previous two seasons,
11% (2015/2016) and 13% (2014/2015) of the
samples were downgraded to COSB.
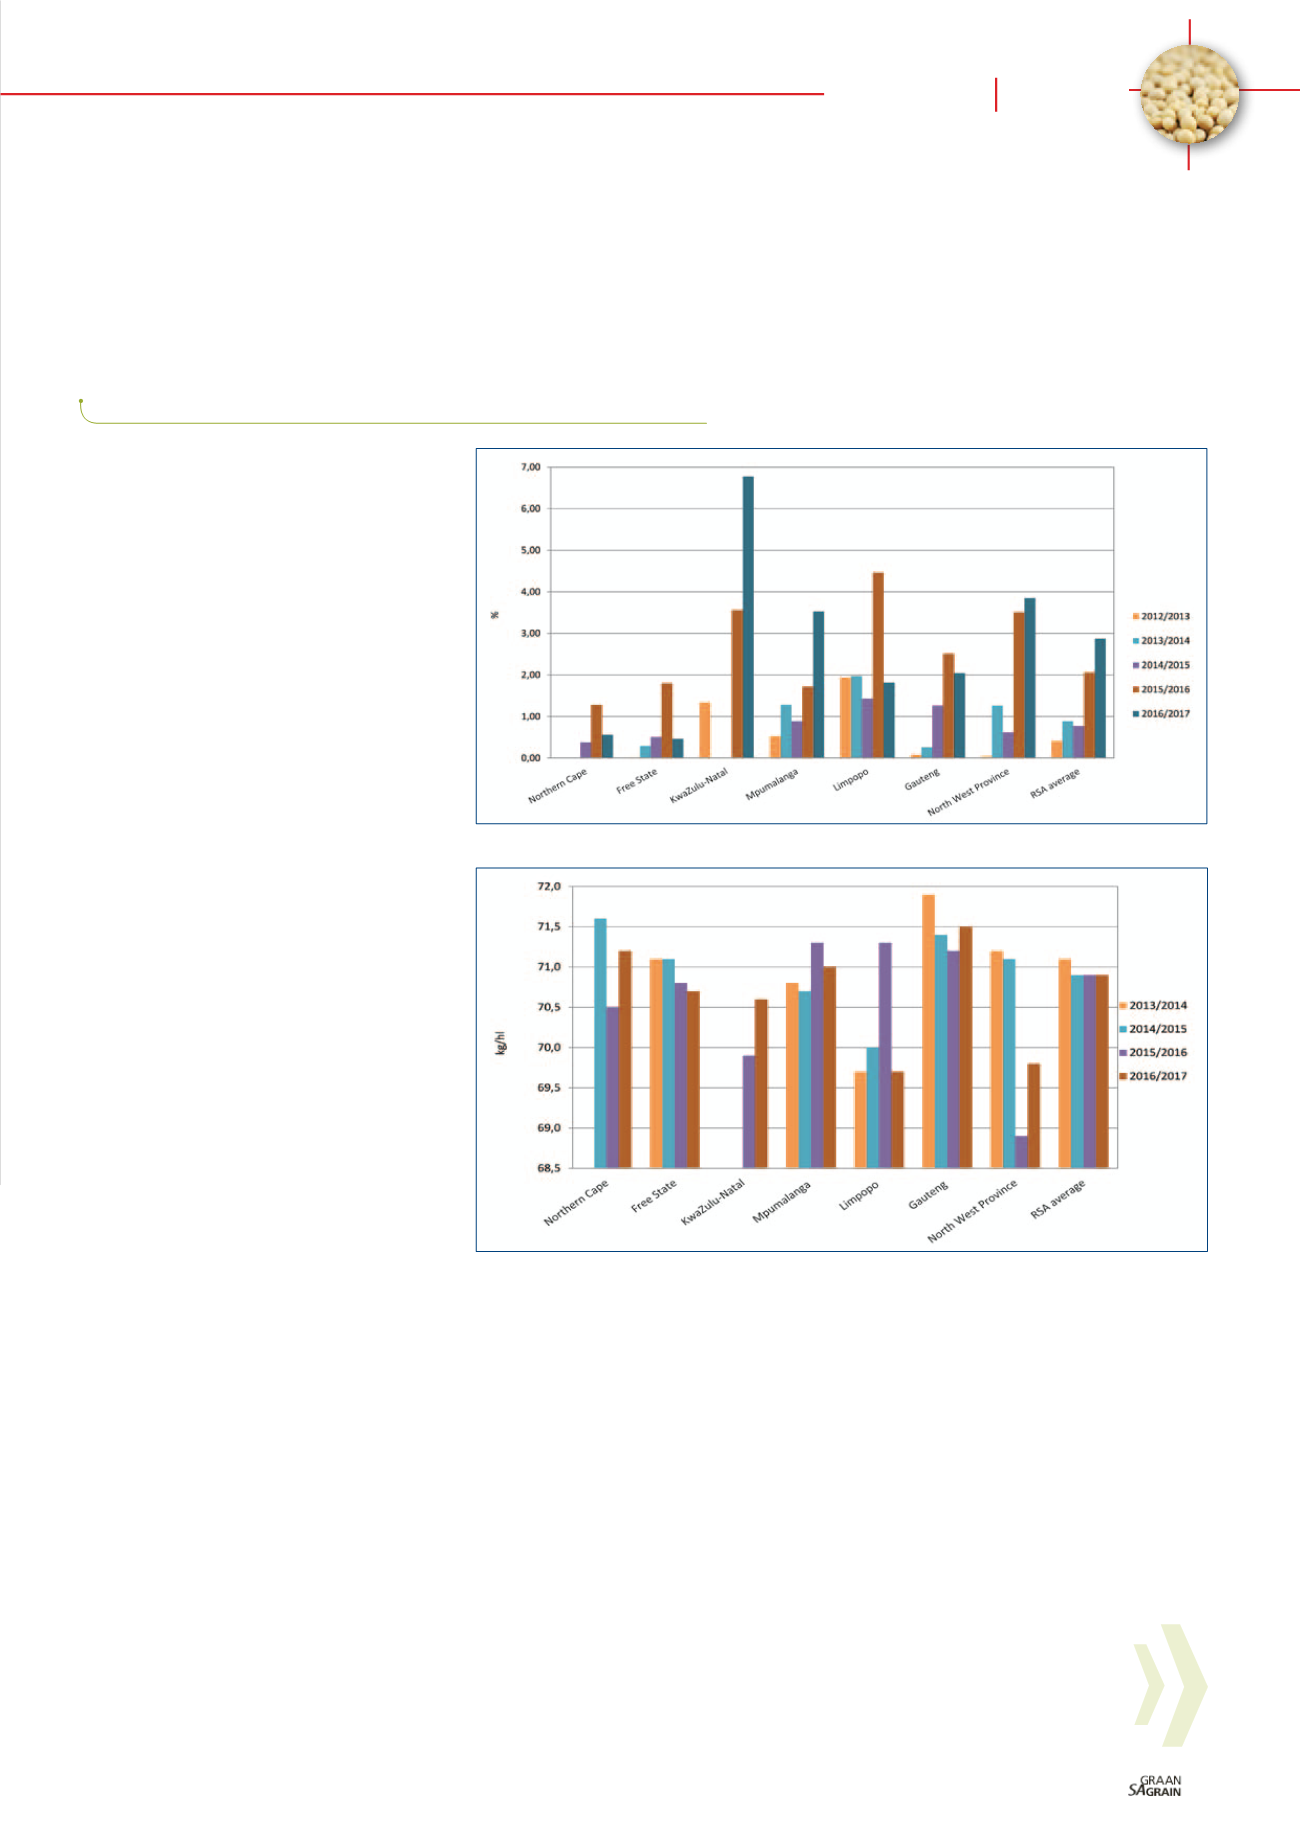
The majority of samples (61%) downgraded
this season, was as a result of the percent-
age soiled soybeans present in the sam-
ple, exceeding the maximum permissible
deviation of 10%. More than half of these
samples originated from Mpumalanga. The
South African weighted average percent-
age soiled soybeans of 2,87% is the high-
est since this survey was started in the
2011/2012 season, when the average was
1,60%. The average last season was 2,06%.
See
Graph 1
for the weighted average per-
centage soiled soybeans per province over
five seasons.
Other deviations resulting in the down-
grading of samples were the percentage
other grain, the percentage sunflower seed
present, the percentage foreign matter, as
well as the presence of poisonous seeds.
None of the samples graded contained any
wet pods.
The national weighted average percent-
age soybeans and parts of soybeans
above the 1,8 mm slotted sieve which pass
through the 4,75 mm round hole sieve, de-
creased from 0,92% the previous season to
0,88% this season. This is the lowest per-
centage of the six seasons for which crop
quality data is available. The national
weighted average percentage defective
soybeans on the 4,75 mm sieve increased
slightly from 2,02% last season to 2,22%
this season.
The percentage of samples contain-
ing sclerotia from the fungus
Sclerotinia
sclerotiorum
, almost tripled from the previ-
ous season (from 25% to 70%). The three
highest percentages of sclerotia observed
(0,38%, 0,36% and 0,30%) were on samples
from Mpumalanga.
soybean crop scrutinised
Jolanda Nortjé,
manager: Laboratory, The Southern African Grain Laboratory
Graph 1: Average percentage soiled soybeans per province over five seasons.
Graph 2: Comparison of the average test weight per province over four seasons.
69
August 2018
Focus
Soybeans
Mini-