DIE SAADBEDRYF
Saad maak ongeveer 12% van ‘n mielieprodusent se
veranderlike produksiekosterekening uit. Graan SA moniteer
saadpryse om deursigtigheid en mededingendheid te
verhoog. Daar word ook deurlopend met rolspelers gesprekke
gevoer oor produsente se behoeftes en bekommernisse.
SAADPRYSE
Die pryse vir die 2015/2016-produksieseisoen is in Mei 2015
bekendgestel. Gemiddelde prysstygings vir mieliesaad
was 5,6%, vir sonneblomsaad was dit 6,6%, graansorghum-
saadpryse het met 10,2% en sojaboonsaadpryse met 5,6%
gestyg. Die Produsenteprysindeksstyging (PPI) vir Mei 2015
was gemiddeld 3,6%.
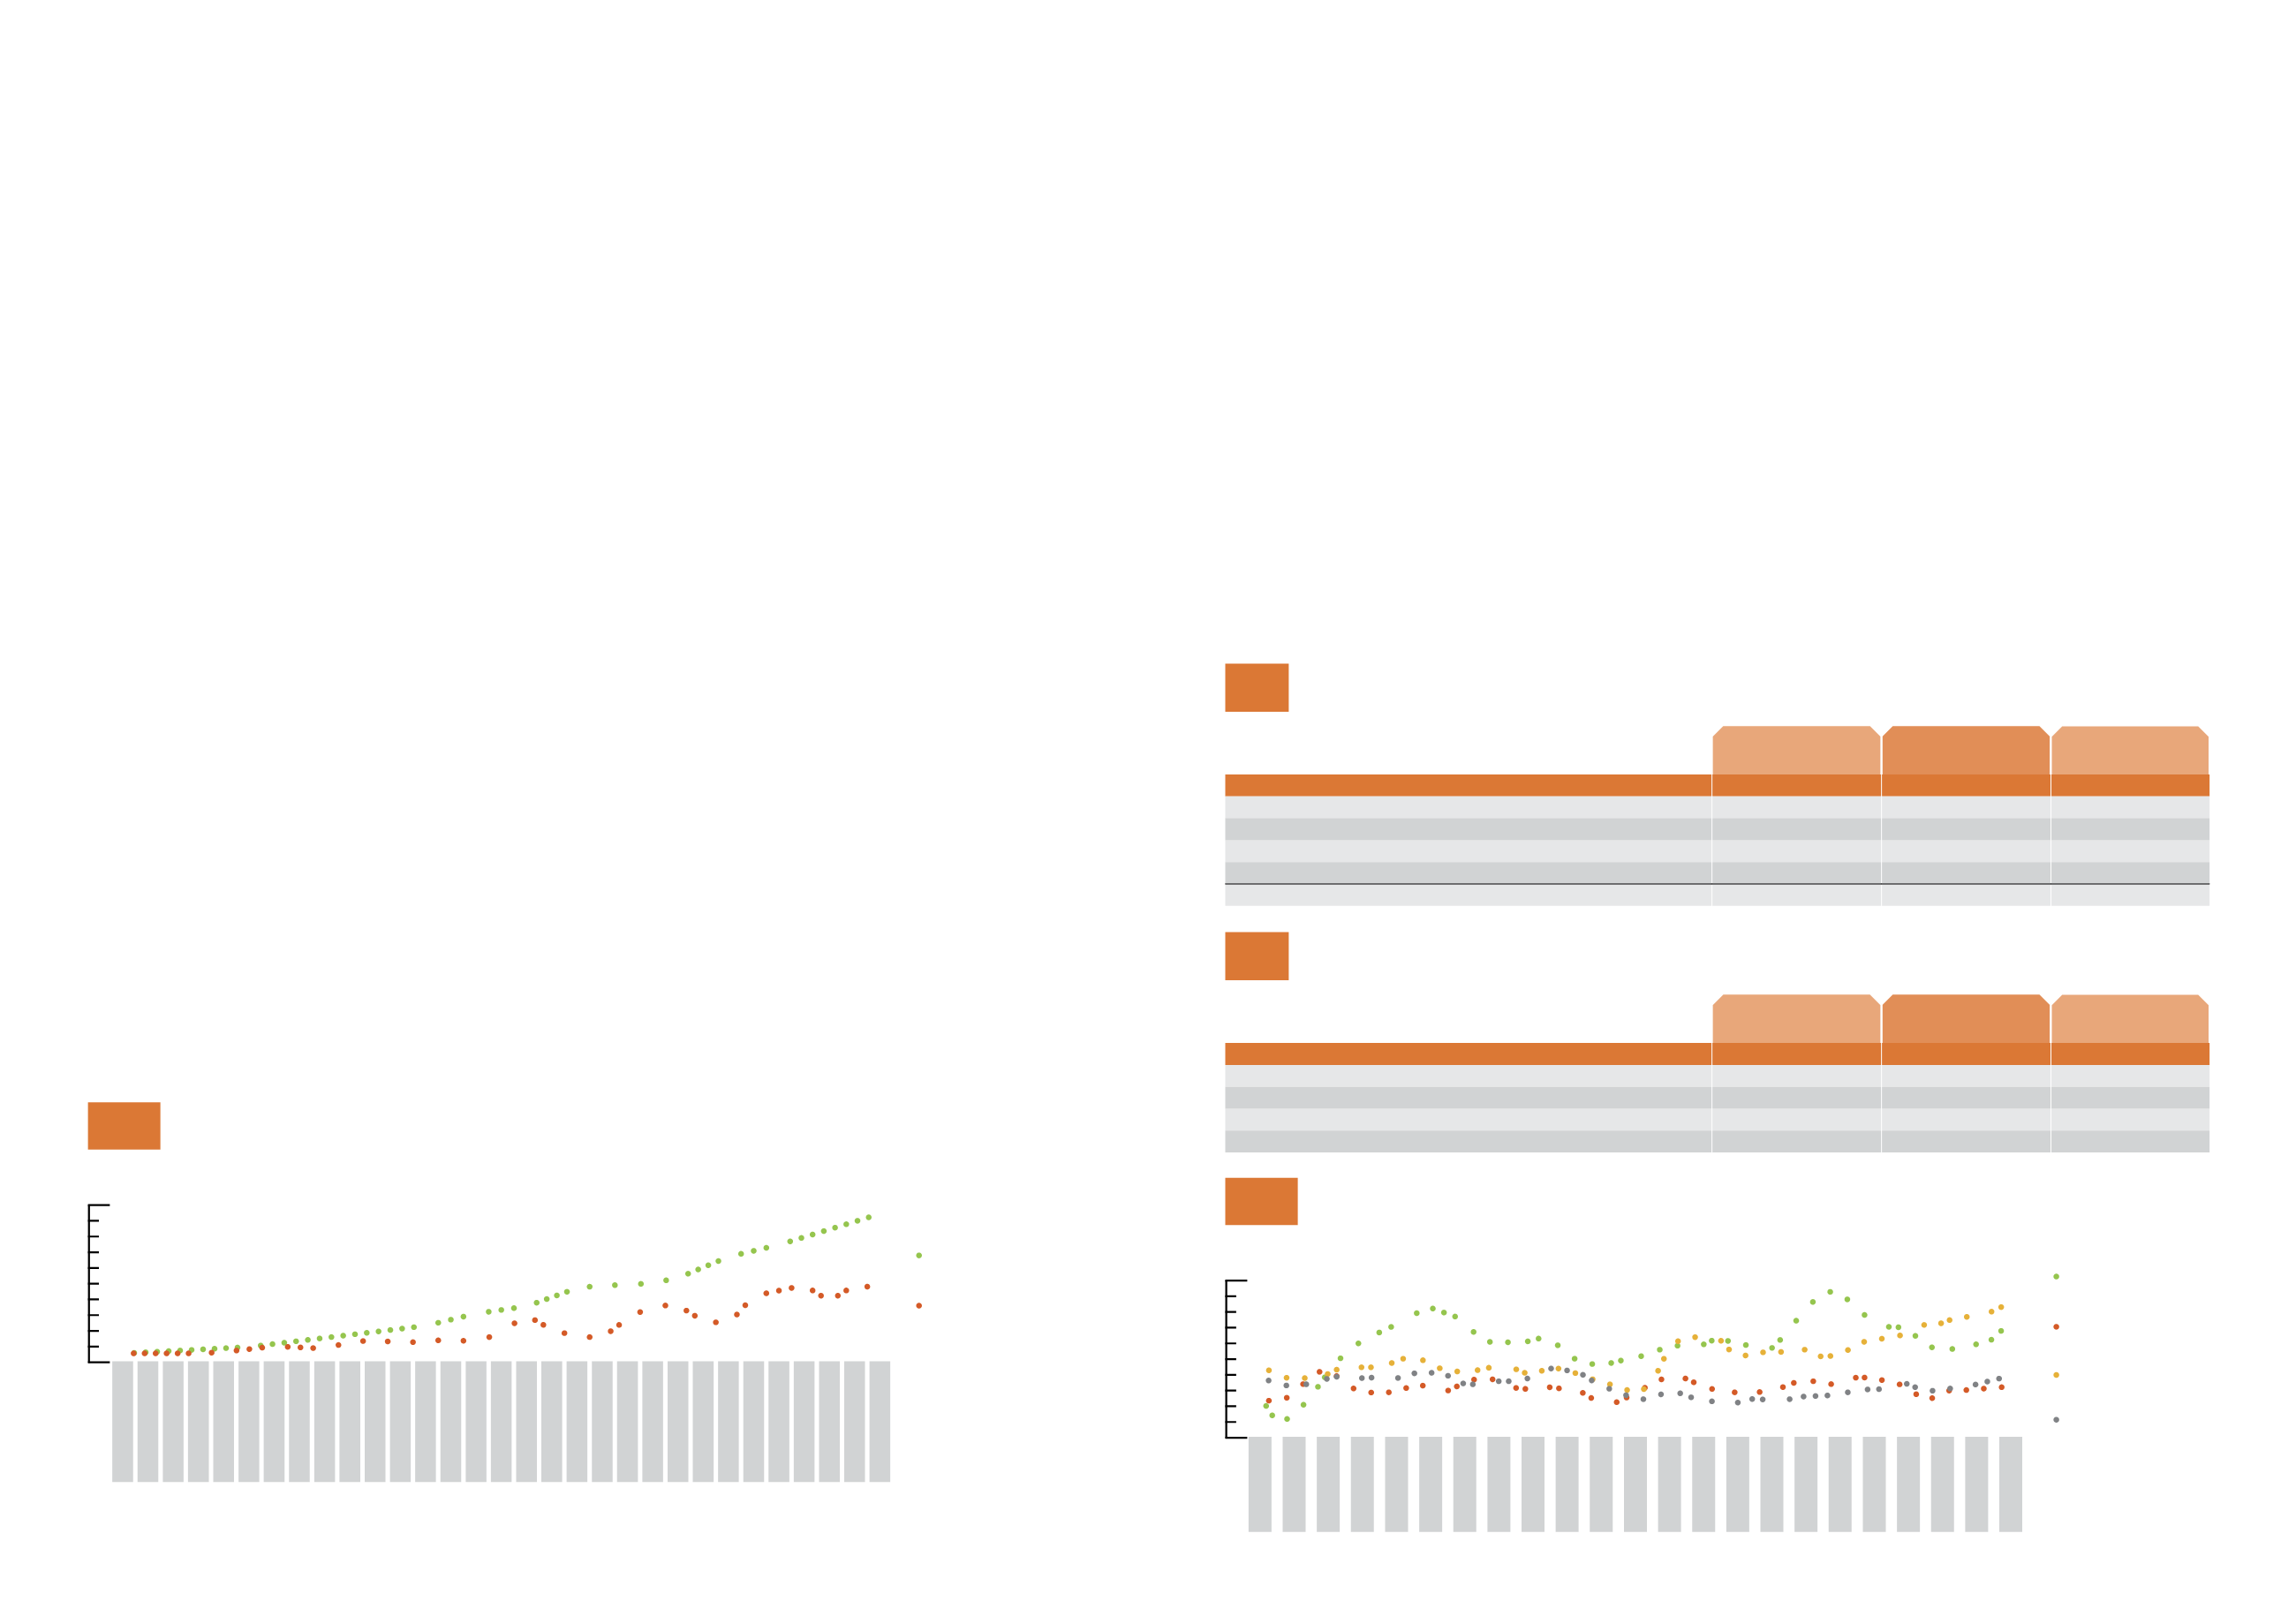
Sedert die 2001/2002-produksieseisoen het die mielieprysin-
deks (
Grafiek 1
) beduidend verswak teenoor die mieliesaad-
prysindeks. Met die voortgesette styging in mieliesaadpryse
en ‘n geraamde gemiddelde produsenteprys
1
van
R2 169 per ton vir die 2015/2016, verswak dit steeds.
SAADMARK
Volgens die NOK is 2 652 850 hektaar mielies in die
2014/2015-produksieseisoen geplant. Dit is 1,3% minder
as in die 2013/2014-seisoen. Indien produsente in 2014/
2015 dieselfde hoe-veelheid saad per hektaar geplant
het, word geraam dat die totale waarde van saad van
R2,742 miljard tot R2,855 miljard, toegeneem het. Volgens
SANSOR was die waarde van die totale saadmark in die
graan- en oliesadebedryf nagenoeg R3,927 miljard vir
die 2014/2015-produksieseisoen.
SAADGEHALTE
Verskeie probleme met saadkwaliteit is aangemeld.
Graan SA-lede is met dispute bygestaan.
TERUGHOUDING VAN SAAD EN KONSEP-TANTIeMEMODEL
Volgens saadmaatskappye word terughousaad jaarliks
vir ongeveer 80% van soja-aanplantings en 70% van
koringaanplantings gebruik.
1
Average producer price = Safex, July 2016 price - average differential cost - handling costs
1
Gemiddelde produsenteprys = Safex, Julie 2016-prys - gemiddelde differensiaalkoste - hanteringskoste
THE SEED INDUSTRY
Seed constitutes about 12% of a maize producer’s
variable production costs. Grain SA monitors seed
prices to increase transparency and competitiveness.
Consultations with role-players on the needs and
concerns of producers are also ongoing.
SEED PRICES
The prices for the 2015/2016 production season were
released in May 2015. Maize seed prices for the 2014/2015
production season rose by 5,6% on average, sunflower
seed prices by 6,6%, grain sorghum seed prices by 10,2%
and soybean seed prices by 5,6%. The average producer
price index (PPI) increase for May 2015 was 3,6%.
Since the 2001/2002 production season the maize price index
(
Graph 1
) weakened significantly compared to the maize
seed price index. With the continued increase in maize seed
prices and with an estimated average producer price
1
of
R2 169 per ton for 2015/2016, the index continues to weaken.
SEED MARKET
According to the CEC, 2 652 850 hectares of maize
were planted in the 2014/2015 production season.
This was 1,3% less than in the 2013/2014 season. Had
producers planted the same quantity of seed per
hectare in 2014/2015, the total value of seed would
have increased from R2,742 billion to R2,855 billion.
According to SANSOR, the value of the total seed
market in the grain and oilseed industry was roughly
R3,927 billion for the 2014/2015 production season.
SEED QUALITY
Several problems with seed quality were reported.
Grain SA assisted its members in disputes.
Farm saved SEED AND DRAFT ROYALTIES MODEL
According to seed companies, roughly 80% of soy
plantings and 70% of wheat plantings are annually
done with farm saved seed.
Graan SA, die saadbedryf (SANSOR), Agbiz Grain, DLBV
en die onderskeie forums het ‘n komitee in die lewe geroep
om na verskillende modelle te kyk om saadmaatskappye te
vergoed vir die negatiewe impak van terughousaad.
Daar is ook gekyk na modelle wat in ander lande gebruik
word om kultivarontwikkeling te finansier, byvoorbeeld
met navorsingsheffings. Daar is besluit om ‘n “eindpunt
tantiemesisteem” te gebruik en die verteenwoordigende
bedryfskomitee maak goeie vordering.
BESKIKBAARHEID VAN SAAD
SANSOR het Graan SA verseker dat voldoende hoeveel-
hede saad vir die 2015/2016-produksieseisoen beskikbaar
sal wees. Saad van sekere gewilde groottes en variëteite
kan dalk beperk wees.
DIE KUNSMISBEDRYF
Suid-Afrika is ‘n netto invoerder van kunsmis. Al die kalium,
asook 60% - 70% van die stikstofbenodighede, word ingevoer.
Suid-Afrika het ook al meer fosfate begin invoer weens
probleme met voorsiening by Foskor. Plaaslike pryse word
International fertiliser prices ($/ton)
Internasionale kunsmispryse ($/ton)
1
Fertiliser
Kunsmis
September 2014 September 2015
% change
% verandering
$/ton
$/ton
Ammonia/
Ammoniak
554
410
-26
Urea/
Ureum
350
258
-26
DAP
436
459
+5
MOP (Potash/
Kalium
)
300
288
-4
Rand/dollar
10,99
13,67
+24
Table
Tabel
International fertiliser prices (R/ton)
Internasionale kunsmispryse (R/ton)
2
Fertiliser
Kunsmis
September 2014 September 2015
% change
% verandering
R/ton
R/ton
Ammonia/
Ammoniak
6 093
5 605
-8
Urea/
Ureum
3 848
3 527
-8
DAP
4 792
6 275
+31
MOP (Potash/
Kalium
)
3 303
3 937
+19
Table
Tabel
Grain SA, the seed industry (SANSOR), Agbiz Grain, the DAFF
and the various forums established a committee to look at
different models for compensating seed companies for the
negative impact of farm saved seed.
They also looked at models used in other countries to
fund cultivar development, for instance with research
levies. It was decided to use an end-point royalty system,
and the representative industry committee is making
good progress.
SEED AVAILABILITY
SANSOR assured Grain SA that a sufficient quantity of
seeds will be available for the 2015/2016 production
season. However, seed of certain popular sizes and
varieties may be limited.
THE FERTILISER INDUSTRY
South Africa is a net importer of fertilisers. All our potassium,
as well as 60% - 70% of our nitrogen requirements, is imported.
South Africa has also started to import increasing quantities
of phosphates because of supply problems at Foskor. Local
Industry Services division
Afdeling bedryfsdienste
Input research and development
Insetnavorsing en -ontwikkeling
28
29
Indices of the price of maize seed and the production price of maize
Indekse van die prys van mieliesaad en die produsenteprys van mielies
1
1985/1986
1986/1987
1987/1988
1988/1989
1989/1990
1990/1991
1991/1992
1992/1993
1993/1994
1994/1995
1995/1996
1996/1997
1997/1998
1998/1999
1999/2000
2000/2001
2001/2002
2002/2003
2003/2004
2004/2005
2005/2006
2006/2007
2007/2008
2008/2009
2009/2010
2010/2011
2011/2012
2012/2013
2013/2014
2014/2015*
2015/2016*
Indices/
Indekse
: 1985/1986 = 100
* Preliminary/
Voorlopig
Maize seed index
Mieliesaadindeks
Maize price index
Mielieprysindeks
Graph
Grafiek
Index/
Indeks
2 000
1 800
1 600
1 400
1 200
1 000
800
600
400
200
0
International fertiliser prices in rand terms
Internasionale kunsmispryse in randterme
2
01/2012
03/2012
05/2012
07/2012
09/2012
11/2012
01/2013
03/2013
05/2013
07/2013
09/2013
11/2013
01/2014
03/2014
05/2014
07/2014
09/2014
11/2014
01/2015
03/2015
05/2015
07/2015
09/2015
Source/
Bron
: FMB Ltd/
FMB Beperk
Ammonia
Ammoniak
DAP
Urea
Ureum
MOP
(Potash/
Kalium
)
Graph
Grafiek
R/t
7 000
6 500
6 000
5 500
5 000
4 500
4 000
3 500
3 000
2 500
2 000


