winsgewendheid daarvan evalueer. Hulle moet besluit of
die Safex-prys voldoende is, en daarvoor stel Graan SA
gedetailleerde ondernemingsbegrotings vir die homogene
produksiestreke van Suid-Afrika op.
2015/2016-produksieseisoen
Die afgelope seisoen (2014/2015) se droogtetoestande
het graan- en oliesaadproduksie in die grootste dele
van Suid-Afrika onder hewige druk geplaas. Met die
nuwe seisoen om die draai, lyk die situasie heelwat
beter weens besonder lae voorraadvlakke, wat plaas-
like pryse ondersteun. Dié styging van produsentepryse
by die meeste somergewasse, maar spesifiek mielies,
The projected sensitivity analyses (break-even yield and price) for the above-average yield maize
dryland scenario for the 2015/2016 production season in the north-western Free State
Die geprojekteerde sensitiwiteitsontledings (gelykbreekopbrengs en -prys) vir die bogemiddelde
droëlandopbrengsscenario vir mielies vir die 2015/2016-produksieseisoen in die Noordwes-Vrystaat
Export
Uitvoer
July 2016
julie 2016
import
invoer
Safex price July 2016
Safex-prys Julie 2016
(R/ton)
1 700
1 900
2 100
2 300
2 450
2 650
2 850
3 400
1 428
1 628
1 828
2 028
2 178
2 378
2 578
3 128
Yield (t/ha)
Opbrengs (t/ha)
3,5
-1 438
-1 238
-1 038
-838
-688
-488
-288
262
4,0
-1 080
-880
-680
-480
-330
-130
70
620
4,5
-801
-601
-401
-201
-51
149
349
899
5,0
-578
-378
-178
22
172
372
572
1 122
5,5
-396
-196
4
204
354
554
754
1 304
6,0
-244
-44
156
356
506
706
906
1 456
4
Table
Tabel
and assess their profitability. They must decide whether the
Safex price is adequate, and Grain SA compiles detailed
business budgets for the homogenous production regions of
South Africa for this purpose.
2015/2016 production season
The drought conditions of the past season (2014/2015)
placed profitable grain and oilseed production in most
parts of South Africa under major pressure. With the new
season around the corner, the situation looks considerably
better as a result of stock levels that are particularly low
and that support local prices. This increase in producer
prices for most summer crops, but specifically for maize,
die afgelope jaar beteken dat produsente se voor-
uitsigte ten opsigte van winsgewendheid beter is.
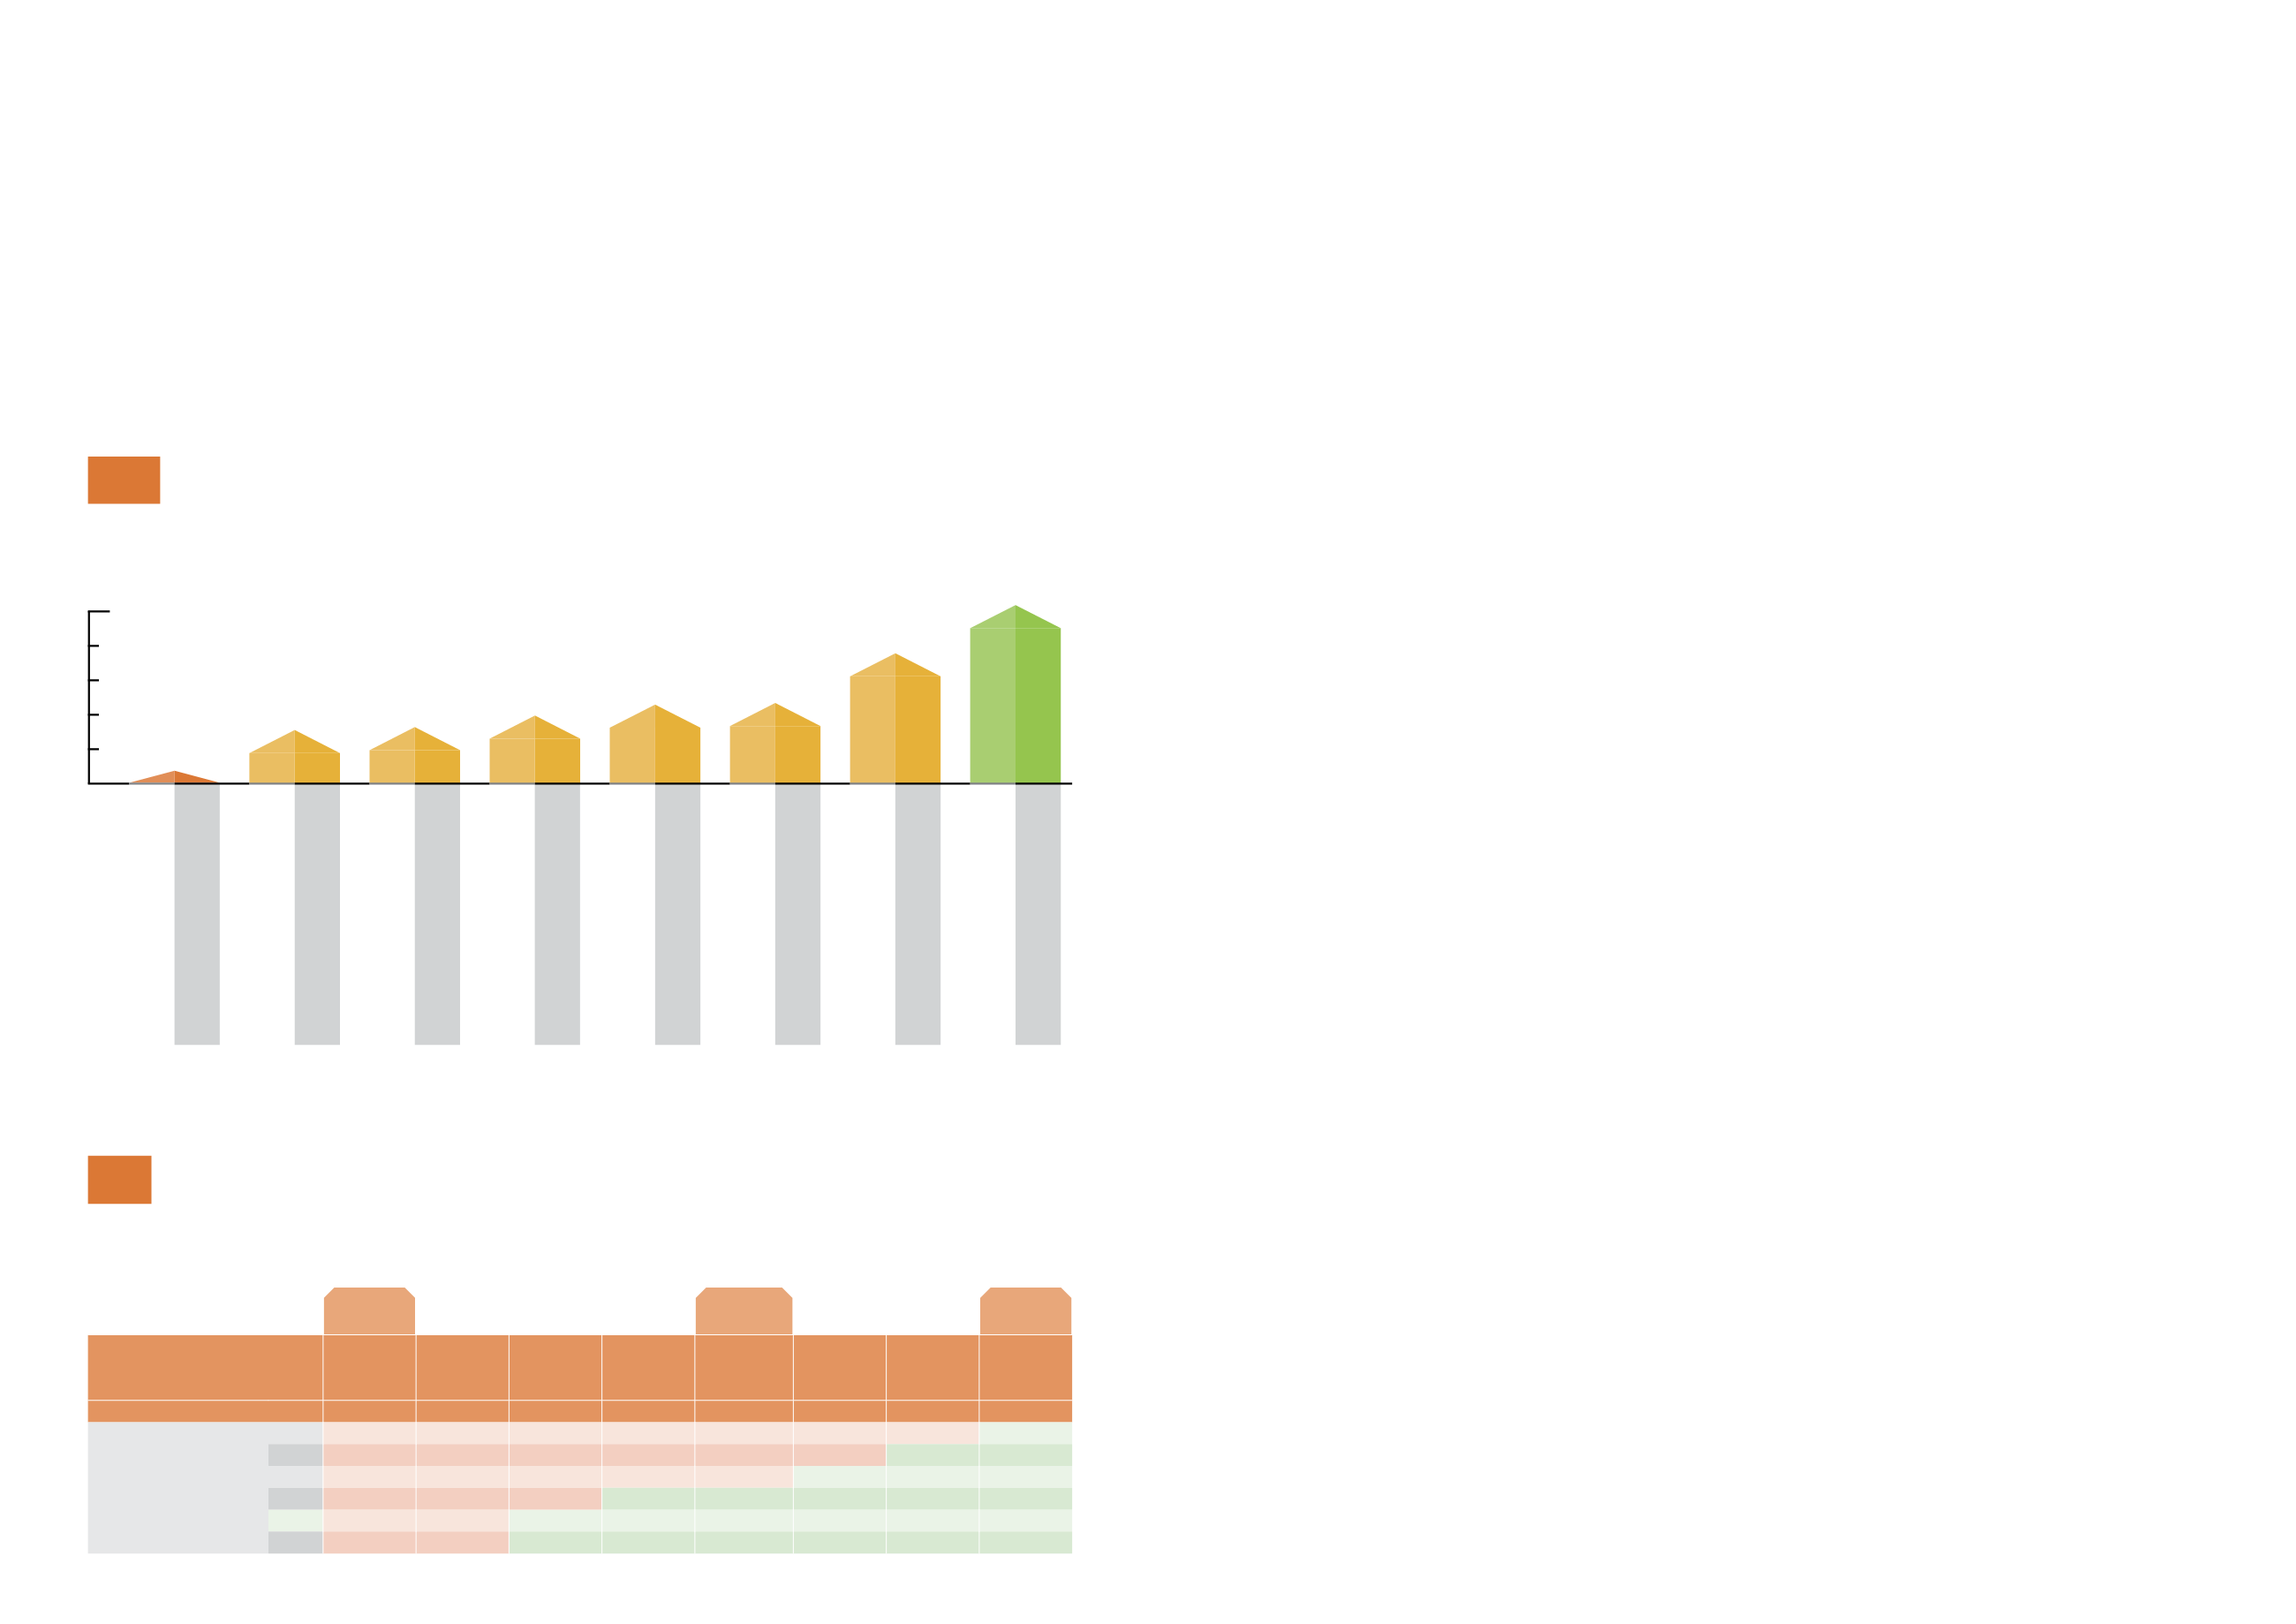
Die winsgewendheid (bruto marge per hektaar en per
ton) van verskillende mielie-opbrengsscenario’s asook
ander graan- en oliesadegewasse wat in die Noordwes-
Vrystaat geplant word, word in
Grafiek 18
getoon vir die
2015/2016-produksieseisoen. Die opbrengsscenario’s is
gegrond op aannames van produksietoestande en kan
dus tussen produsente verskil.
Let wel:
Hoewel die inligting
slegs vir die Noordwes-Vrystaat-produksiegebied getoon
word, is dit ook vir die ander streke beskikbaar. Die
vergelykende analise (
Grafiek 18
) wys dat grondbone die
beste bruto marge vir die komende produksieseisoen toon.
Sensitiwiteitsontledings
Die geprojekteerde sensitiwiteitsontledings (gelykbreek-
opbrengs en -prys) vir die bogemiddelde-opbrengs droë-
landscenario vir mielies vir die 2015/2016-produksieseisoen
in die Noordwes-Vrystaat word in
Tabel 4
getoon.
Met die opstel van die begroting was die Julie 2016
Safex-mielieprys gemiddeld R2 450/ton, wat ongeveer
R2 178/ton in die produsent se sak is nadat die liggings-
differensiaal, hanteringskoste en bemarkingskommissie
in ag geneem is. Die geraamde produksiekoste vir ‘n op-
brengs van 4,5 t/ha is gebruik. Die totale veranderlike koste
om ‘n hektaar mielies vir dié opbrengs te plant, is ongeveer
R7 831/ha. ‘n Berekende vastekoste-komponent (salarisse,
huur, lewenskoste, elektrisiteit, ensovoorts) van R2 200/ha
moet by ‘n totale produksiekoste van R10 031/ha
gevoeg word.
Indien die Safex-prys teen die geraamde begrote insetkoste
(vaste plus veranderlike koste) realiseer, moet ‘n produsent ten
minste 4,5 t/ha oes stroop om gelyk te breek. Indien slegs die
veranderlike koste in ag geneem word, moet ‘n produsent se
opbrengs meer as 3,5 t/ha wees as hy wil gelykbreek. Hierdie
tabel beklemtoon dat produsente se winsgewendheidsituasie
beter as verlede jaar lyk, hoofsaaklik weens hoër mieliepryse
na die onlangse droogte.
Insetnavorsing en
-ontwikkeling
INLEIDING
Die
rand/dollar-wisselkoers en die prys van ruolie speel
‘n belangrike rol in die vorming van plaaslike insetpryse.
Vanaf Oktober 2014 tot Oktober 2015 het die waarde van
die rand met 21% teen die VSA-dollar verswak. Die prys
van Brent-ruolie het oor dieselfde tydperk van $88 tot
$41 per vat (43%) gedaal.
Die groothandelprys van diesel in Gauteng het met 12%
gedaal. Mielie-, sonneblom-, sojaboon-, en graansorghum-
saadpryse het gemiddeld onderskeidelik met 5,6%, 6,6%, 5,6%
en 10,2% gestyg, vergeleke met die vorige seisoen. Die prys
van KAN, MAP en kaliumchloried het onderskeidelik met 5%,
13% en 6% gestyg en die prys van ureum het met 2% gedaal.
Die pryse van feitlik alle internasionale landbouchemiese
middels het op ‘n jaargrondslag gedaal. Omdat die
wisselkoers so skerp verswak het, is hierdie dalings nie
noodwendig in plaaslike markte gesien nie. Op ‘n
jaargrondslag het die pryse van landboumasjinerie
en -toerusting met gemiddeld 4,5% gestyg.
over the past year has led to better profitability prospects
for producers.
The profitability (gross margin per hectare and per ton) of
different maize yield scenarios as well as other grain and
oilseed crops planted in the north-western Free State is indica-
ted in
Graph 18
, as applicable to the 2015/2016 production
season. The yield scenarios are based on assumptions of
production conditions and may therefore differ between
producers.
Note:
although the information in the next section
is shown only for the north-western Free State production area,
it is available for the other regions as well. The comparative
analysis (
Graph 18
) demonstrates that groundnuts display the
best gross margin for the coming production season.
Sensitivity analyses
The projected sensitivity analyses (break-even yield and price)
for the above-average yield maize dryland scenario for the
2015/2016 production season in the north-western Free State is
shown in
Table 4
.
During the drafting of the budget the July 2016 Safex
maize price was on average R2 450/ton, which is
approximately R2 178/ton in the producer’s pocket after
considering the location differential, handling costs and
marketing commission. The estimated production cost of
a 4,5 t/ha yield was used during compilation. The total
variable cost to plant a hectare of maize for this yield is
about R7 831/ha. A calculated fixed-cost component
(salaries, rent, cost of living, electricity, etc.) of R2 200/ha
must be added to a total production cost of R10 031/ha.
If the Safex price should realise at the estimated
budgeted input cost (fixed plus variable costs), a
producer should harvest at least 4,5 t/ha to break
even. By taking into account only the variable costs, a
producer must yield more than 3,5 t/ha to break even.
This table highlights that producers’ profitability situation
looks better than last year, mainly due to the higher
maize prices after the recent drought.
Input research and
development
INTRODUCTION
The
rand/dollar exchange rate and crude oil prices play
an important role in determining local input prices. From
October 2014 to October 2015 the value of the rand
dropped by 21% against the US dollar. The price of Brent
crude oil declined from $88 per barrel to $41 per barrel
(43%) over the same period.
The domestic wholesale price of diesel in Gauteng
decreased by 12%. Maize, sunflower, soybean and grain
sorghum seed prices increased by an average of 5,6%,
6,6%, 5,6% and 10,2% respectively compared with the
previous season. The price of LAN, MAP and potassium
chloride increased by 5%, 13% and 6% respectively, and
the price of urea dropped by 2%. The prices of almost all
international agrochemical substances dropped on an
annual basis. Because the exchange rate weakened
so drastically, these decreases where not necessarily
seen in local markets. On an annual basis the prices of
agricultural machinery equipment were on average
4,5% higher.
Industry Services division
Afdeling bedryfsdienste
Input research and development
Insetnavorsing en -ontwikkeling
Produksiekoste (vervolg)
PRODUCTION costs (continued)
26
27
Maize/
Mielies
Lower yield/
Laer opbrengs
Sunflower/
Sonneblom
Average yield/
Gemiddelde opbrengs
Maize/
Mielies
Average yield/
Gemiddelde opbrengs
Soybeans/
Sojabone
Average yield/
Gemiddelde opbrengs
grain Sorghum/
Graansorghum
Average yield/
Gemiddelde opbrengs
Maize/
Mielies
Average yield/
Gemiddelde opbrengs
(
less till/
verminderde bewerking)
Maize/
Mielies
Higher potential/
Hoër potensiaal
Groundnuts/
Grondbone
Average yield/
Gemiddelde opbrengs
The profitability (gross margin) of grain and oilseeds in R/ha for different yield scenarios
in the north-western Free State area (2015/2016 production season)
Die winsgewendheid (bruto marge) van graan en oliesade in R/ha vir verskillende opbrengsscenario’s
in die Noordwes-Vrystaat-omgewing (2015/2016-produksieseisoen)
18
Graph
Grafiek
Gross margin/
Bruto marge
7 500 R/ha
* The Safex futures used in this scenario calculation were/
Die Safex-termynkontrakte wat in hierdie scenarioberekening gebruik is:
• Maize for delivery in July 2016/
Mielies vir lewering in Julie 2016
= R2 450/t
• Sorghum for delivery in July 2016/
Sorghum vir lewering in Julie 2016
= R3 500/t
• Soybeans for delivery in May 2016/
Sojabone vir lewering in Mei 2016
= R4 900/t
• Sunflower or delivery in May 2016/
Sonneblom vir lewering Mei 2016
= R4 900/t
• Groundnuts for delivery/
Grondbone vir lewering
= R11 000/t (choice/
keur
)/R7 500/t (diverse/
divers
)/R4 500/t (press/
pers
)
6 000
4 500
3 000
1 500
0
3,5 t/ha
1,8 t/ha
4,5 t/ha
1,8 t/ha
3,0 t/ha
4,5 t/ha
7,3 t/ha
1,5 t/ha


