


 30 / 116

Oktober 2017
28
FOCUS
Irrigation
Special
Modelling of water use progresses
‘Some sectors, like the sugar industry, have
detailed maps, but others only have an ap-
proximate figure for how many thousand
hectares of a crop are grown in different
areas,’ she explains. ‘We’ve received the
most information from the Western Cape,
because the provincial Department of
Agriculture has been funding aerial surveys
where field boundaries have been digitised
and crops allocated to them.’
Earlier this year, the department advertised
a tender to update the data collected in
the previous surveys, which mapped and
georeferenced all agricultural commod-
ity production and related infrastructure. A
summer and winter ‘flyover’ survey will be
conducted at an altitude low enough to dis-
tinguish the various types of summer and
winter crops, with vehicle-based surveys
undertaken where this is not possible.
Obtaining up-to-date information is benefi-
cial, because producers sometimes change
the crops planted according to market forc-
es or climatic conditions. Dr Jarmain notes,
for example, that some ‘wine producers’ in
the Western Cape have reverted to grow-
ing apples, plums or citrus as they were
struggling to make ends meet. Indeed, wine
organisation VinPro reports that the aver-
age return on investment fell below 1% in
2016, with some 40% of the 3 300 producers
making a loss. The value of the rand, compe-
tition on the international market and price
fluctuations due to supply and demand,
are just some of the factors influencing
the profitability of any exported product.
In the case of climatic conditions, the
drought that began in the northern parts
of the country in 2013 intensified over the
next two years and by the end of 2015 five
provinces – North West Province, KwaZulu-
Natal, Free State, Limpopo and Mpumalan-
ga – had declared disaster status. According
to the Bureau for Food and Agricultural Pol-
icy (BFAP), many producers switched from
soybeans, which declined by more than
180 000 ha from 2015 to 2016, to sunflower.
The crop is known to be more resilient in
drought conditions and has an extended
planting window in the western parts of
the summer rainfall region, so the area
under cultivation expanded by more than
140 000 ha.
Of course, droughts affect crop yields too.
In 2015 the country’s total maize harvest
was 30% less than the previous year, even
though the area planted had only decreased
by 1,3%. According to the South African
Weather Service, 2015 was the driest year
on the national rainfall record, which dates
back to 1904. Given that rainfall and bio-
mass production are such key parameters
in the ETLook model, is there a concern that
the 2014 to 2015 reference year selected
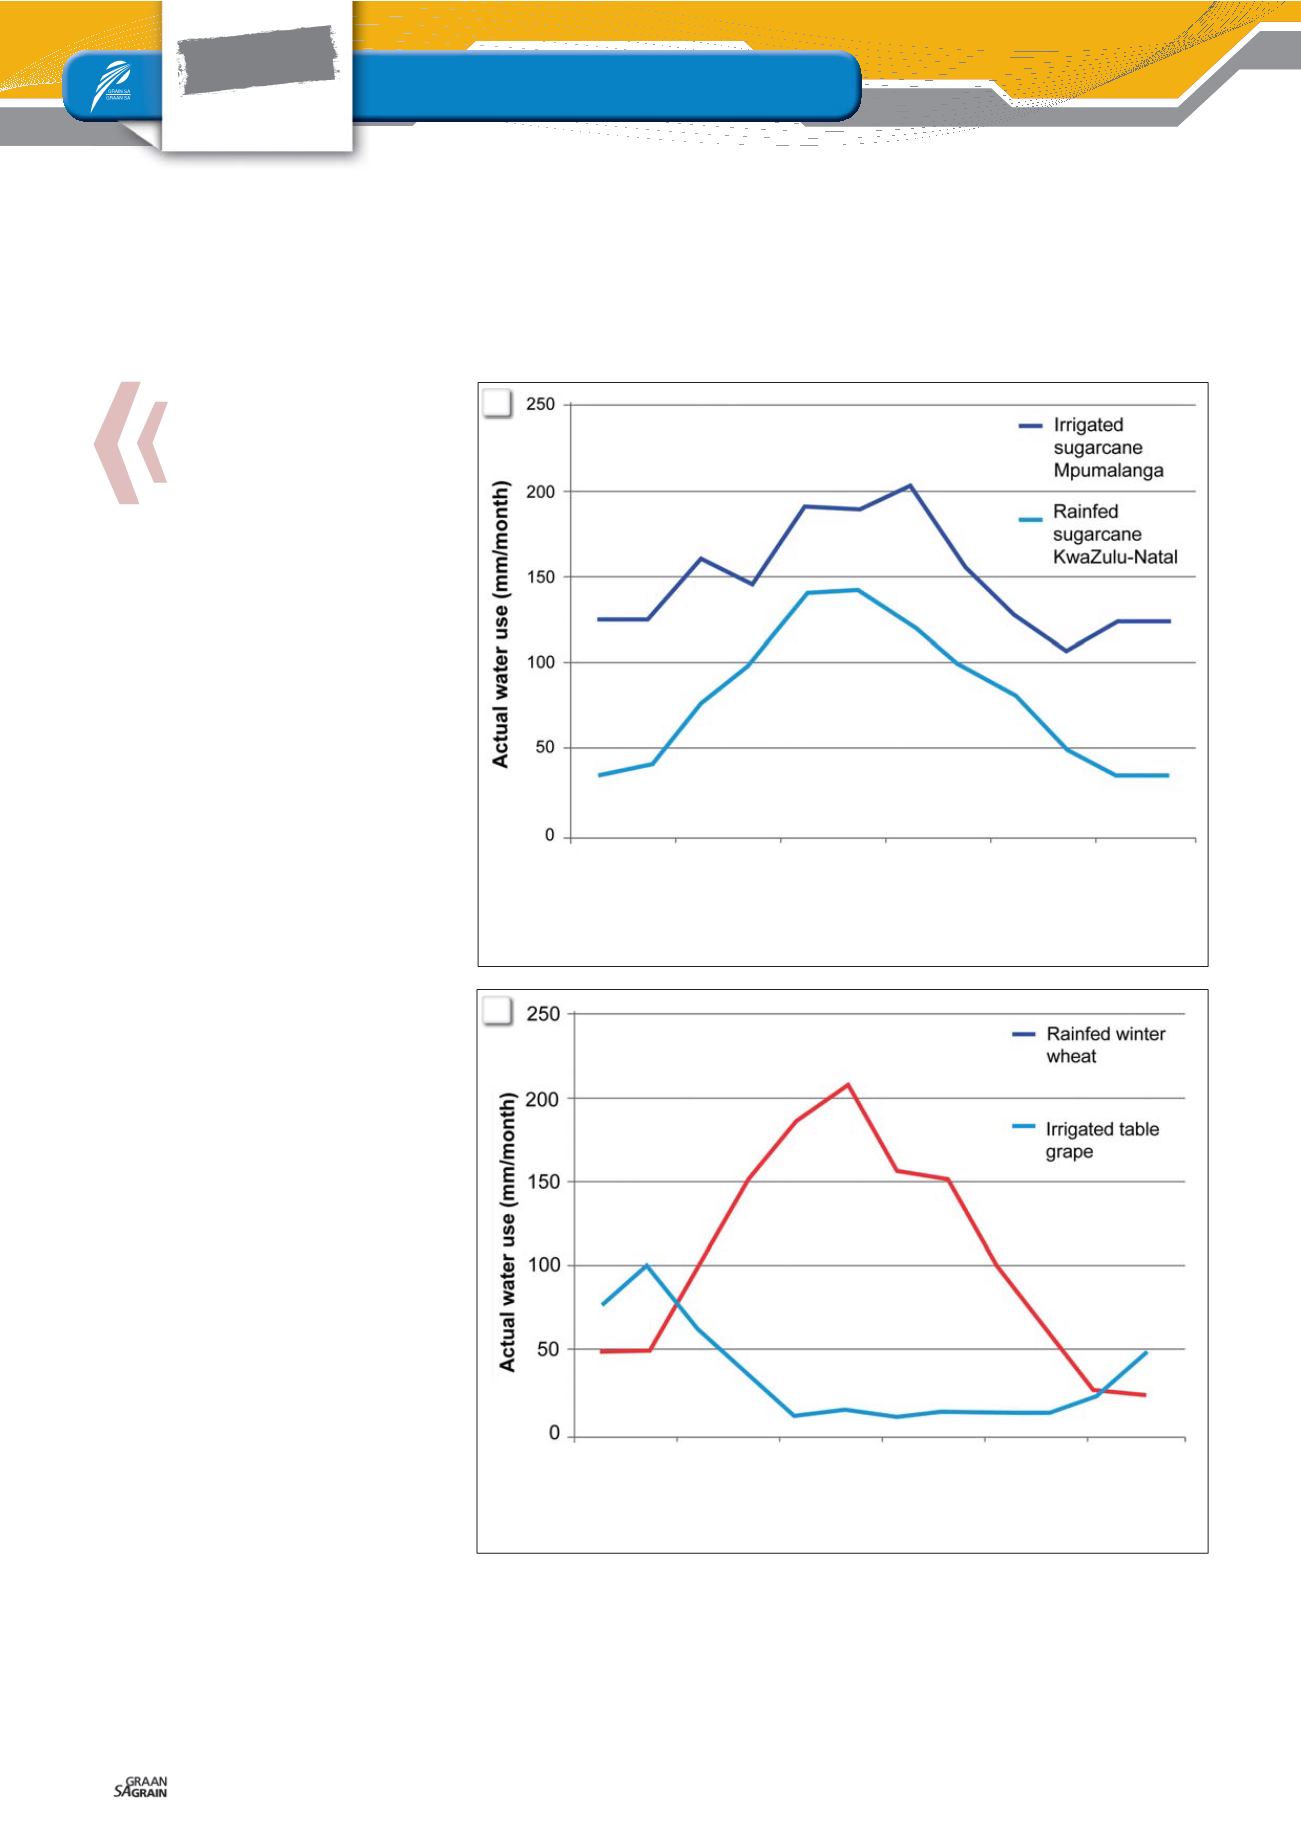
August 2014
October 2014
December 2014
February 2015
April 2015
June 2015
Graph 2a and Graph 2b: Actual monthly water use (mm) of irrigated and rainfed sugarcane
(Graph 2a) and rainfed winter wheat and irrigated table grapes (Graph 2b).
August 2014
October 2014
December 2014
February 2015
April 2015
June 2015
2a
2b