


 28 / 116

Oktober 2017
26
Modelling of water use progresses
A
Water
Research
Commission
(WRC)-funded project team, using
a novel approach to estimate the
total area and water use associat-
ed with irrigated agriculture in South Africa,
is seeking feedback on the initial findings.
According to the National Development
Plan published by government in 2012,
agriculture has the potential to create close
to a million new jobs by 2030, but one of
the actions needed to achieve this is to ex-
pand irrigated agriculture.
‘Evidence shows that the 1,5 million ha un-
der irrigation (which produce virtually all
South Africa's horticultural harvest and
some field crops) can be expanded by at
least 500 000 ha through the better use of
existing water resources and developing
new water schemes,’ the document states.
During the intervening five years, these sen-
timents have been called into question by
various role-players from government, aca-
demia and agribusinesses. Although most
agree that irrigation efficiency can – and
should – be greatly improved, they view the
proposed expansion as overly ambitious,
particularly since water shortages already
being experienced in so many catchments
may worsen with climate change. Practi-
cally achievable targets for expansion of ir-
rigation at provincial level are detailed in the
Irrigation Strategy for South Africa, pub-
lished by the Department of Agriculture,
Forestry and Fisheries (DAFF) in 2015.
There is also uncertainty over the accuracy
of the quoted 1,5 million ha under irriga-
tion, because estimates vary by a couple of
hundred thousand hectares on either side
of this figure and the area actually irrigat-
ed, changes slightly from year to year. The
National Water Act requires registration of
irrigation water use on the Water Authorisa-
tion and Registration Management System
(WARMS) database, capturing the ‘who,
where, why and how much’ details. This
information has been analysed and re-
sults published for 2008 and 2014 (see the
South African Irrigation Institute presenta-
tion at the SANCID 2014 Symposium on
www.sancid.org.za ), but it is acknowled-
ged that more detailed analysis and verifi-
cation of the WARMS database is required.
Now a WRC project is using an ‘eye in the
sky’ approach to develop a methodology
that would allow the area under irrigated
agriculture to be mapped on a regular
basis, while also estimating the volume of
water used. Entitled ‘Wide-scale model-
ling of water use and water availability with
earth observation/satellite imagery’, the
FOCUS
Irrigation
Special
SUE MATTHEWS,
Water Research Commission
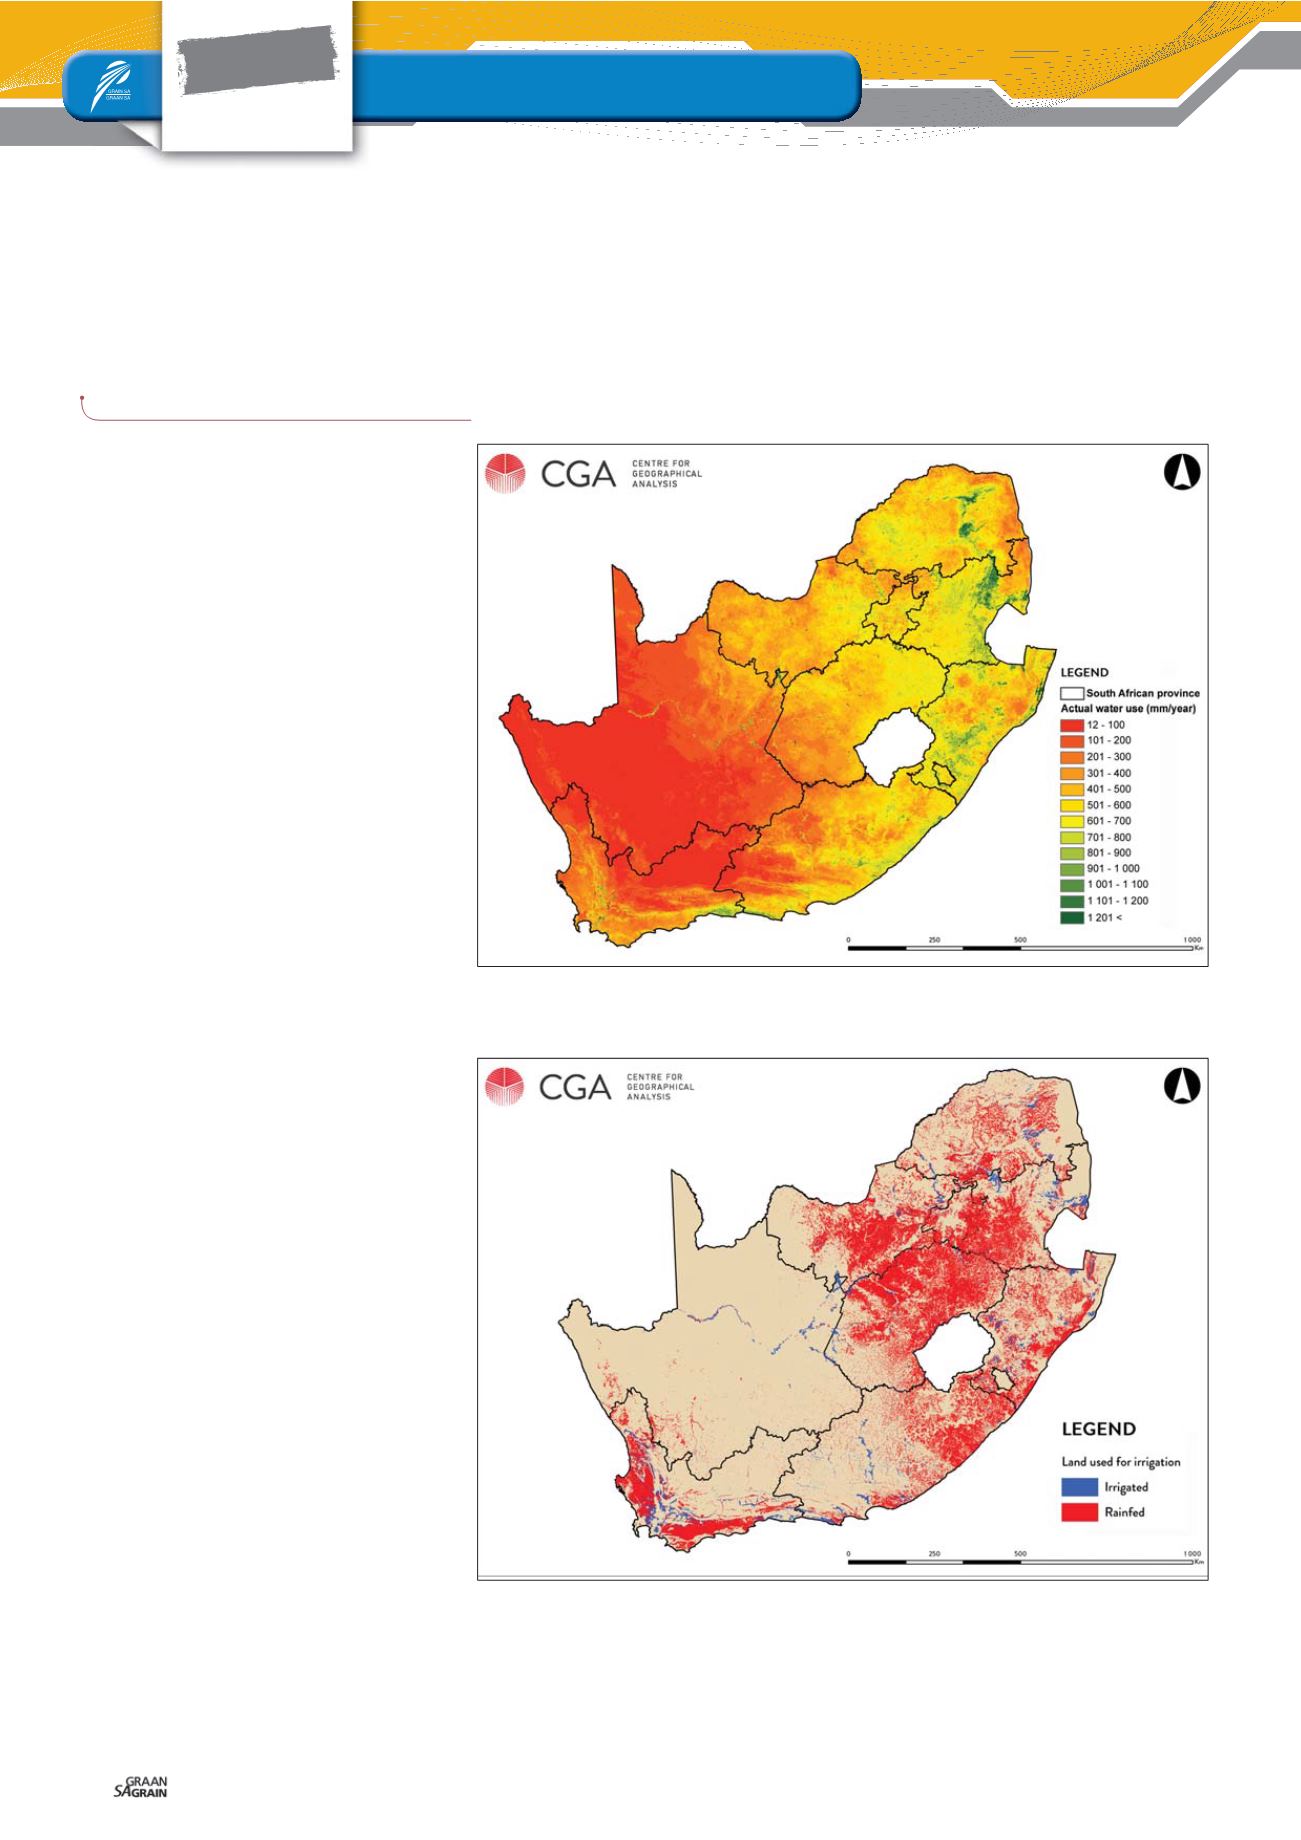
Figure 1: The map of actual evapotranspiration for the year 2014/2015 shows areas with
higher water use by vegetation in green and lower water use in red, which is influenced by
water availability, climatic conditions and the type of vegetation or crop.
Figure 2: Actively irrigated agricultural areas for the year 2015/2016 are shown in blue on
this map of South Africa, while rainfed areas are depicted in red.