


 29 / 116

27
October 2017
project (no. K5/2401, with a summary pub-
lished in the WRC Knowledge Review for
2014/2015) is jointly funded by the WRC
and DAFF and is being conducted by a
collaborative team under the leadership of
Prof Adriaan van Niekerk of Stellenbosch
University.
Essentially, water consumption by crops
can be determined by estimating actual
evapotranspiration (ET) from remote-
sensing data, processed with complex
algorithms. This is not the first time the
approach has been used in South Africa.
A previous WRC project by Jarmain
et al
.
(2014, WRC Report No. TT 602/14) used sat-
ellite imagery and the Surface Energy Bal-
ance Algorithm for Land (SEBAL) model to
estimate actual evapotranspiration, as well
as biomass production, crop yield and wa-
ter use efficiency, for maize and sugarcane
in selected growing areas in the Northern
Cape and Mpumalanga respectively. That
research, which included extensive field
measurements and comparison with other
models, demonstrated the accuracy of
the SEBAL model and the benefits of a re-
mote-sensing approach.
In 2009, however, the developers of SEBAL
in The Netherlands had released ETLook,
a more advanced model, and it was decided
that this should be used to produce actual
evapotranspiration data for the entire coun-
try and to update information on the area
under irrigation.
‘Because we’re looking at the whole of
South Africa, with its big climatic gradients,
the ETLook model is more suitable than
SEBAL, which was developed for a smaller
area with more homogeneous climate,’ says
Dr Caren Jarmain, a key member of the
project team. ‘ETLook also splits the evapo-
transpiration into evaporation and transpi-
ration, which we could not do with SEBAL.’
The period 1 August 2014 to 31 July 2015
was chosen for the project, with satellite,
land cover and meteorological data fed into
the model to produce daily outputs that
were combined to generate twelve month-
ly actual evapotranspiration maps. These
monthly maps were in turn aggregated into
an annual actual evapotranspiration map,
which represents a ‘snapshot’ for that year
of the water use by vegetation, expressed
in mm/year, over the entire country at a res-
olution of 250 m.
Next, South Africa’s likely irrigated areas
were mapped as accurately as possible us-
ing remote sensing and other spatial data
on land cover and field boundaries. The
annual actual evapotranspiration map and
an annual rainfall map were then used to
create a map showing the difference be-
tween water use and rainfall for every
250 m x 250 m pixel.
Applying the assumption that irrigation is
likely to occur where water use exceeds the
rainfall, the first version of the irrigated agri-
cultural map was generated.
‘This seemed to work reasonably well for
most areas, but there were a few excep-
tions, so our approach was further refined,’
explains Dr Jarmain.
A sophisticated machine-learning analysis
was performed using additional datasets
derived from high-resolution remote sens-
ing and ETLook modelling that took into
account the different climatic regions of
South Africa, as well as seasonal influences.
The project team is now seeking feedback
on this second version of the map, but re-
minding respondents that the map shows
actively irrigated agricultural areas for the
year 2014/2015 rather than the current situ-
ation. Landowners and water managers can
visit the web portal
http://sungis10.sun.ac.za/fields_wrc/
to zoom into their area of
interest and check whether particular fields
are correctly labelled as either irrigated or
rain-fed. They can also identify areas under
shade-net, enter any other comments, and
select the relevant crop type.
Providing information on crop type would
allow the project team to estimate the wa-
ter consumed by specific crops. They have
already done this in certain areas where
such data is available, which has allowed for
some interesting comparisons. For exam-
ple, a plot of the monthly water use of a field
of irrigated table grapes against one with
rain-fed wheat in the Western Cape shows
that the wheat used slightly more water
than the grape crop during the wet winter
months and peaked in September, but the
grapes consumed significantly more water
in summer.
Another example illustrating the differ-
ence between irrigated and rain-fed fields
of the same crop type shows that irrigated
sugarcane in Mpumalanga used consider-
ably more water than rain-fed sugarcane in
KwaZulu-Natal throughout the year.
While these two examples compared indi-
vidual fields, water use information can also
be extracted for multiple fields of a crop
type to glean an understanding of the varia-
tion in water use due to differences in water
availability, efficiency of water use, culti-
vation, irrigation systems, cultivars, soils
and other factors.
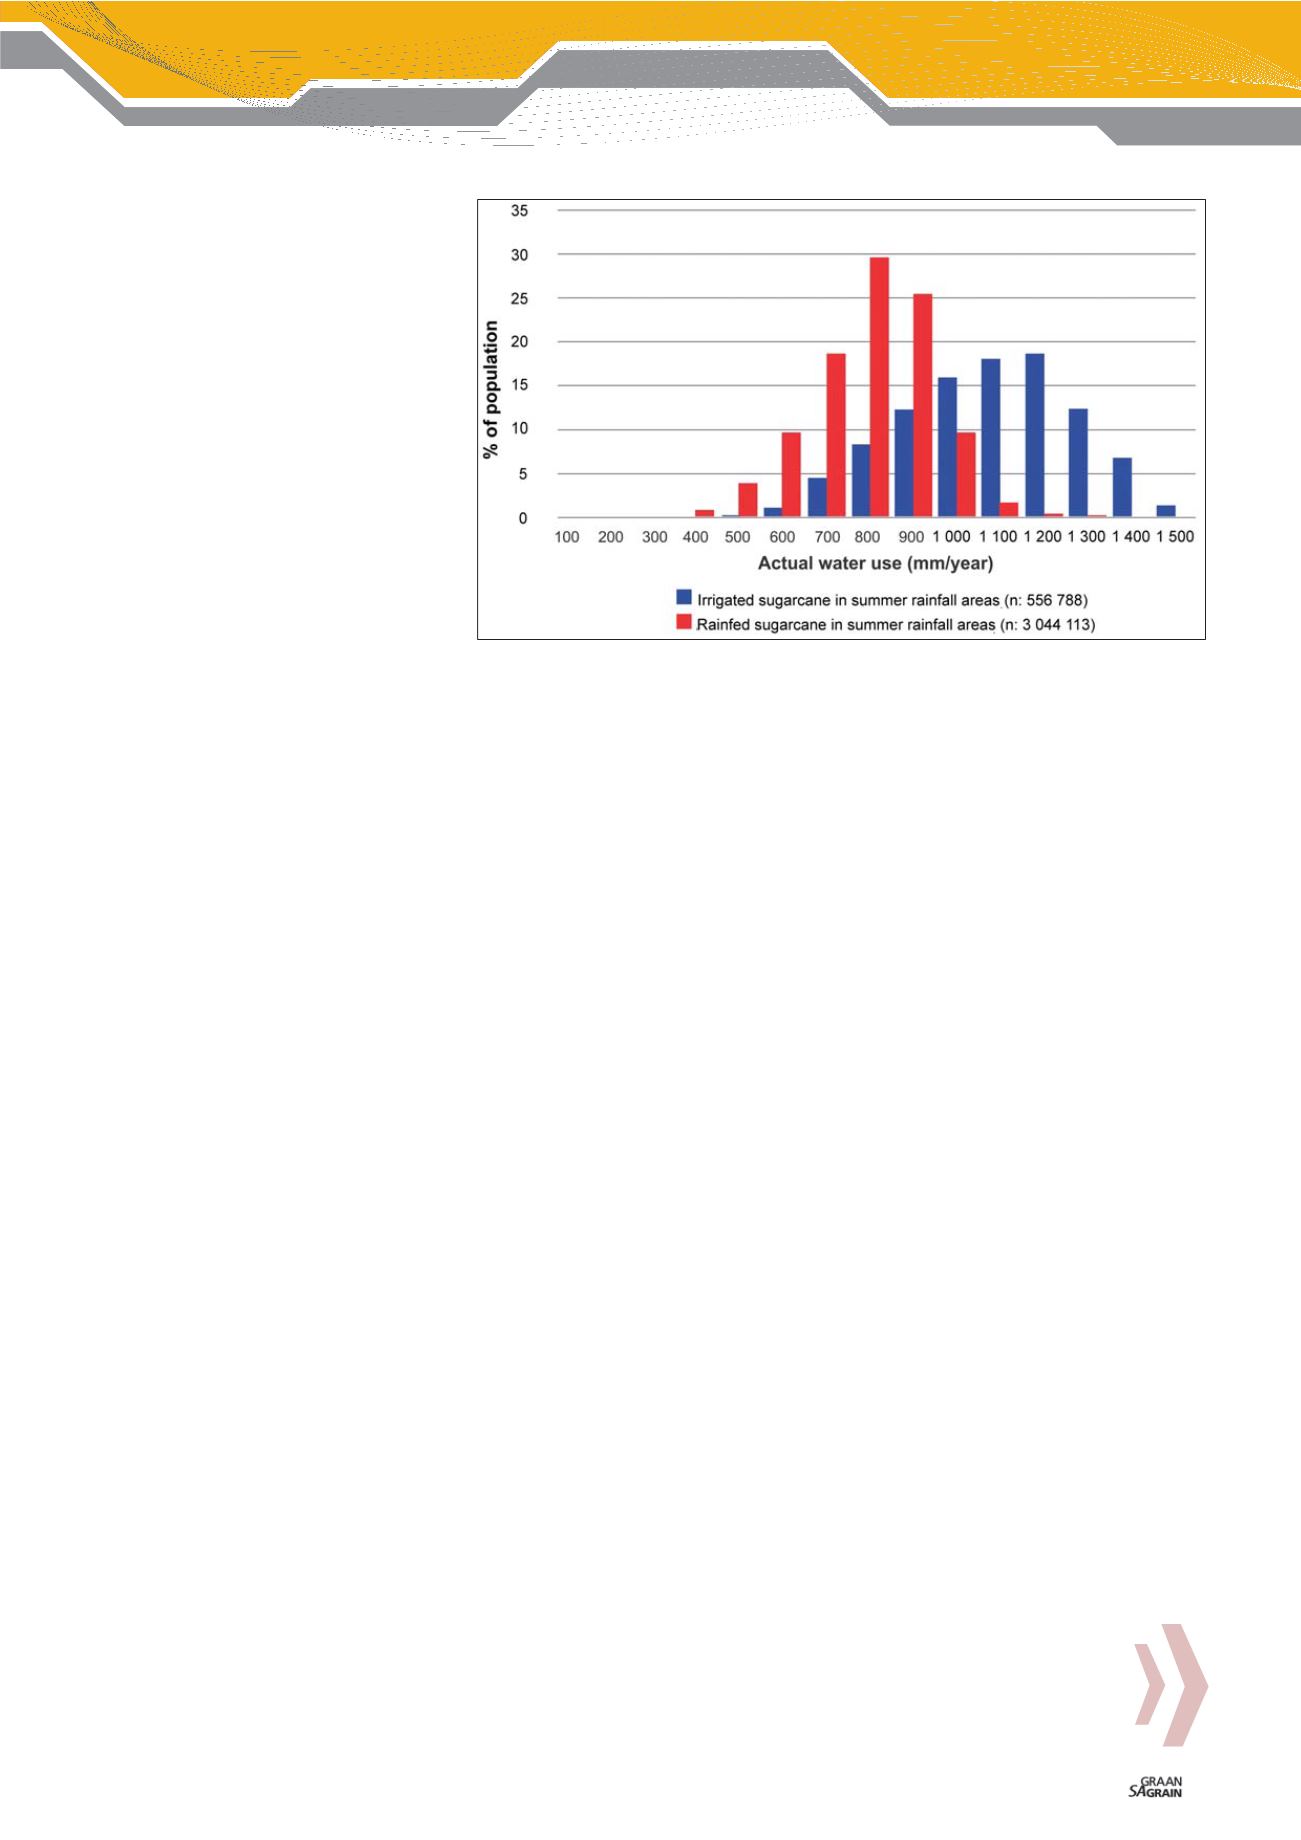
Again considering sugarcane, which is com-
mercially grown in the summer rainfall re-
gion, analyses of large areas showed that
most of the population in rain-fed fields
had an annual water consumption of be-
tween 700 mm and 900 mm, while the bulk
of the population in irrigated fields used
1 000 mm to 1 200 mm. In the winter rainfall
region, irrigated apples were found to have
used more water during the year than irri-
gated citrus.
The project team would like to do more of
such analyses, in light of the fact that many
new cultivars and crops have been intro-
duced to South Africa over the past 20 years
and little is known about their water use and
crop water requirements.
‘Our methodology allows us to tell whether
or not a field is irrigated and we can do a wa-
ter use estimate even if we don’t know what
the crop type is – that’s the beauty of a re-
mote-sensing model like ETLook,’ explains
Dr Jarmain. ‘But knowing what the crops are
would certainly add more value.’
The challenge, however, is to find reliable
information on crop distribution.
Graph 1: Analysis conducted for large areas of sugarcane in the summer rainfall region
reveal the difference in water use between irrigated (blue) and rainfed (red) sugarcane.