


 33 / 116

31
October 2017
Three approaches to mapping waterlogged and salt-affected areas
were identified as potential solutions. The first is a modelling ap-
proach whereby hydrological, terrain and soil data is used to deter-
mine where waterlogging or salt accumulation is likely to occur.
Another approach is to differentiate affected and unaffected soils
by making use of remotely-sensed imagery (hyperspectral or mul-
tispectral) to analyse their spectral properties. This direct remote
sensing method is consequently applied to exposed (bare) soil.
The third approach, referred to as the indirect remote sensing
approach, examines vegetation response (e.g. loss of biomass) to
saline or waterlogged conditions.
It became clear that image texture (heterogeneity) is an important
feature for identifying areas that are likely to be salt-affected or
waterlogged. The newly-developed within-field anomaly detection
(WFAD) method is based on the principle that heterogeneous areas
are in many cases indicative of waterlogging or salt accumulation.
Affected areas often stand out as being spectrally different com-
pared to the rest of a field, either because of a reduction in biomass
due to saline or saturated conditions (in cultivated fields) or due to
specific species of vegetation occurring in fallow fields. Although
such ‘anomalies’ can be easily identified using visual interpretation
of imagery, they are not easily extracted from remotely-sensed data.
Traditional remote sensing techniques involve classifying individual
pixels (cells) without taking topology (relationships between spatial
entities) into consideration. The results showed that, compared to
the other methods evaluated, within-field anomaly detection pro-
duced the most promising results for monitoring and quantification
purposes.
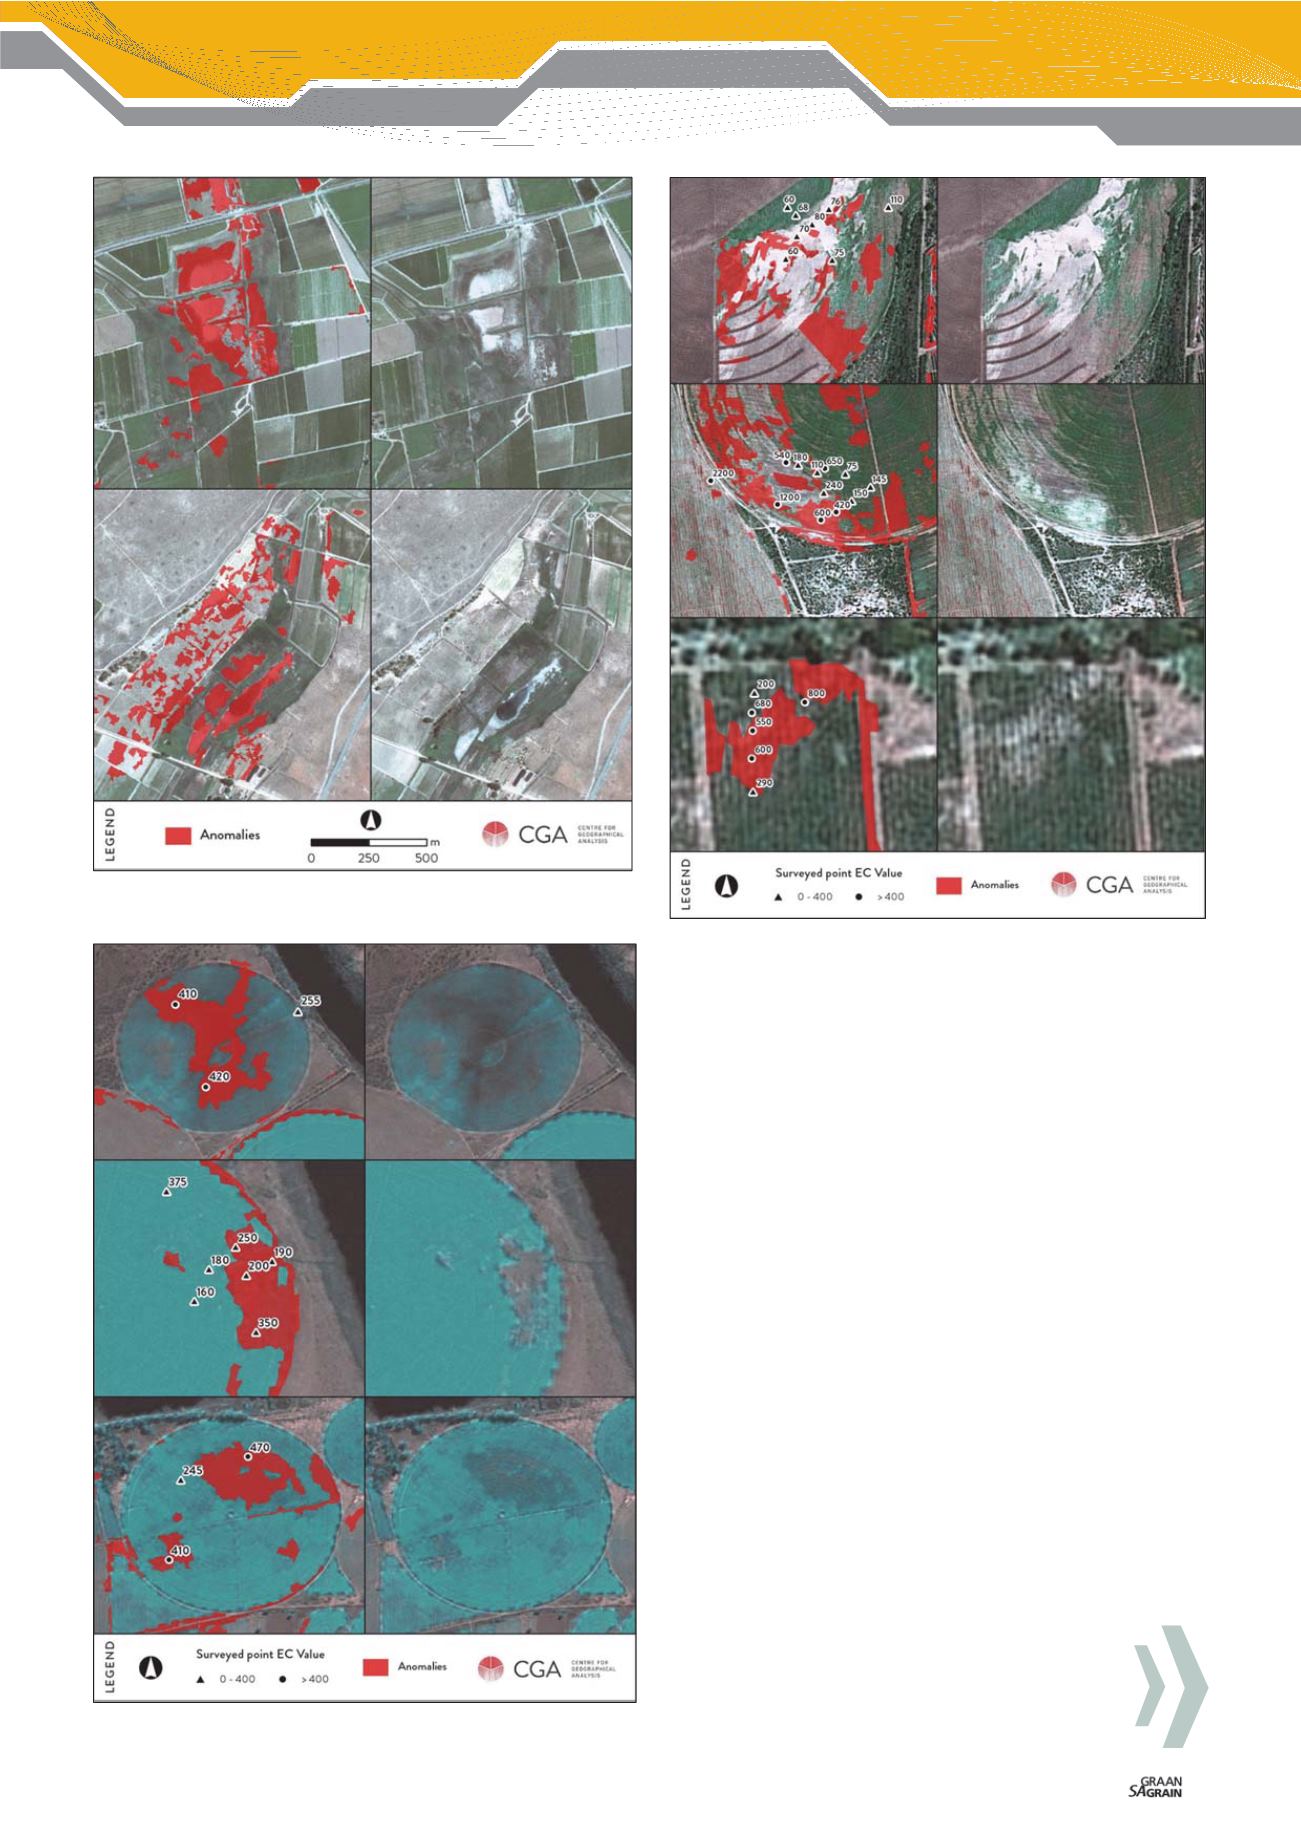
Figure 1: Examples of large anomalies detected at Olifants River Irrigation
Scheme (Vredendal) that were confirmed to be related to waterlogging.
Figure 3: Examples of large anomalies detected at Douglas that were
confirmed to be related to salt accumulation or waterlogging.
Figure 2: Examples of large anomalies detected at Pont Drift that
were confirmed to be related to flooding, waterlogging and/or salt
accumulation.