


 43 / 92

41
May 2015
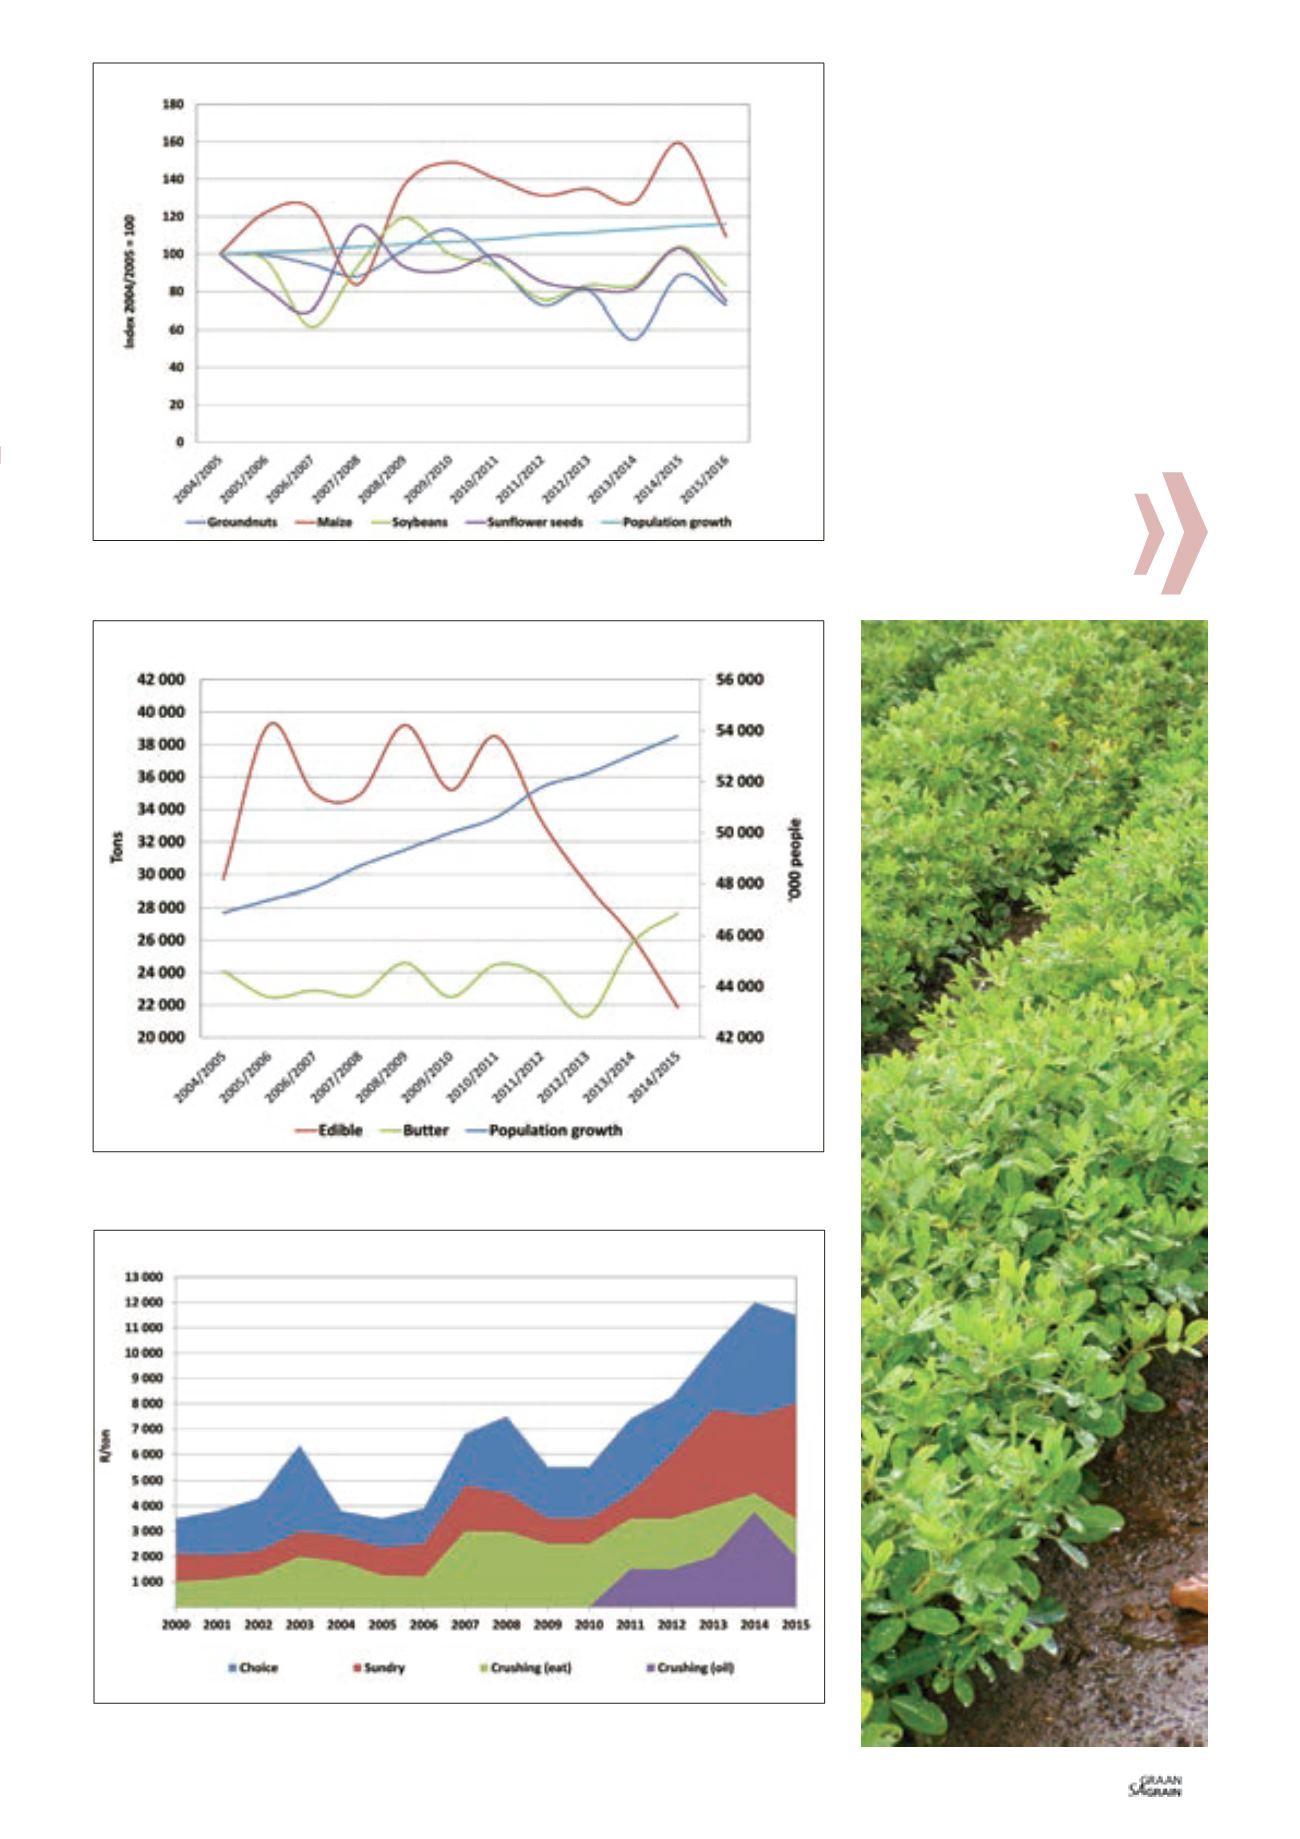
– a 15% growth from 2004/2005 consump-
tion. The edible groundnut market was fair-
ly stable between 2004/2005 and 2010/2011.
It declined significantly with 47% between
2011/2012 and 2014/2015 largely due to in-
creased prices in the domestic edible mar-
ket (see
Graph 4
).
From 2000 to 2010, groundnut producer
prices traded below R8 000/ton. At the
same time the domestic consumption of
groundnuts was fairly stable. Prices started
increasing in 2010, mainly driven by inter-
national price movements on the back of a
growing global appetite.
International groundnut prices (US Runner
40/50, Rotterdam prices) increased by 45%
between 2000 and 2010; from $884/ton to
$1 284/ton. At the same time, the domestic
“choice grade” producer price increased by
57%, from R3 500/ton to R5 500/ton (see
Graph 4). Moreover, increasing production
costs also added to these price increases.
Graph 2: Growth in yields (ton/ha).
Source: Grain SA (2015)
Graph 3: South African groundnut consumption versus population growth.
Source: Grain SA (2015)
Graph 4: South African groundnut producer prices.
Source: Grain SA (2015)
SA Grain/
Sasol Chemicals (Fertiliser) photo competition