


 46 / 124

FOCUS
Seed
Special
GM maize seed:
Contribution to yield gain
PETRU FOURIE,
economist, Industry Services, Grain SA
T
he main challenge for agricultural production is to keep up
with population growth and demand. The world has to pro-
duce more food, applying all available research and technol-
ogy in order to increase production on fewer hectares of
land available.
One of the features South Africa applied in order to achieve the
above was to produce genetically modified (GM) crops.
The start of GM crops in South Africa
In 1997 South Africa became the first country in Africa to commer-
cially produce genetically modified crops. Approval has been grant-
ed for commercial production of three GM crops. These include
approval for GM cotton, GM maize (the first approvals of each of
these crops occurred in 1997) and GM soybeans (first approved
in 2001). These GM crops either have resistance to insect pests or
tolerance to broad range herbicides, or both. Multinational seed
companies are leading the research of GM crops in South Africa.
GM crop growth in South Africa
South Africa’s adoption of GM crops expanded at an impressive
rate since it was planted for the first time. A project funded by the
Maize Trust, surveys and analyses the adoption of genetically modi-
fied maize by producers in South Africa, on an annual basis, in order
to establish an updated database on GM plantings available to indus-
try stakeholders.
According to the survey’s data, GM maize seed was introduced in
the 1999/2000 production season with only 3 000 hectares planted.
During 2001/2002 approximately 5,5% (166 000 hectares) of South
Africa’s total maize crop was planted with GM maize seed and this
figure kept on growing. The figures for the 2013/2014 production
season indicates that approximately 2,36 million hectares of GM
maize was cultivated, representing 86,9% of the total maize area
planted in South Africa.
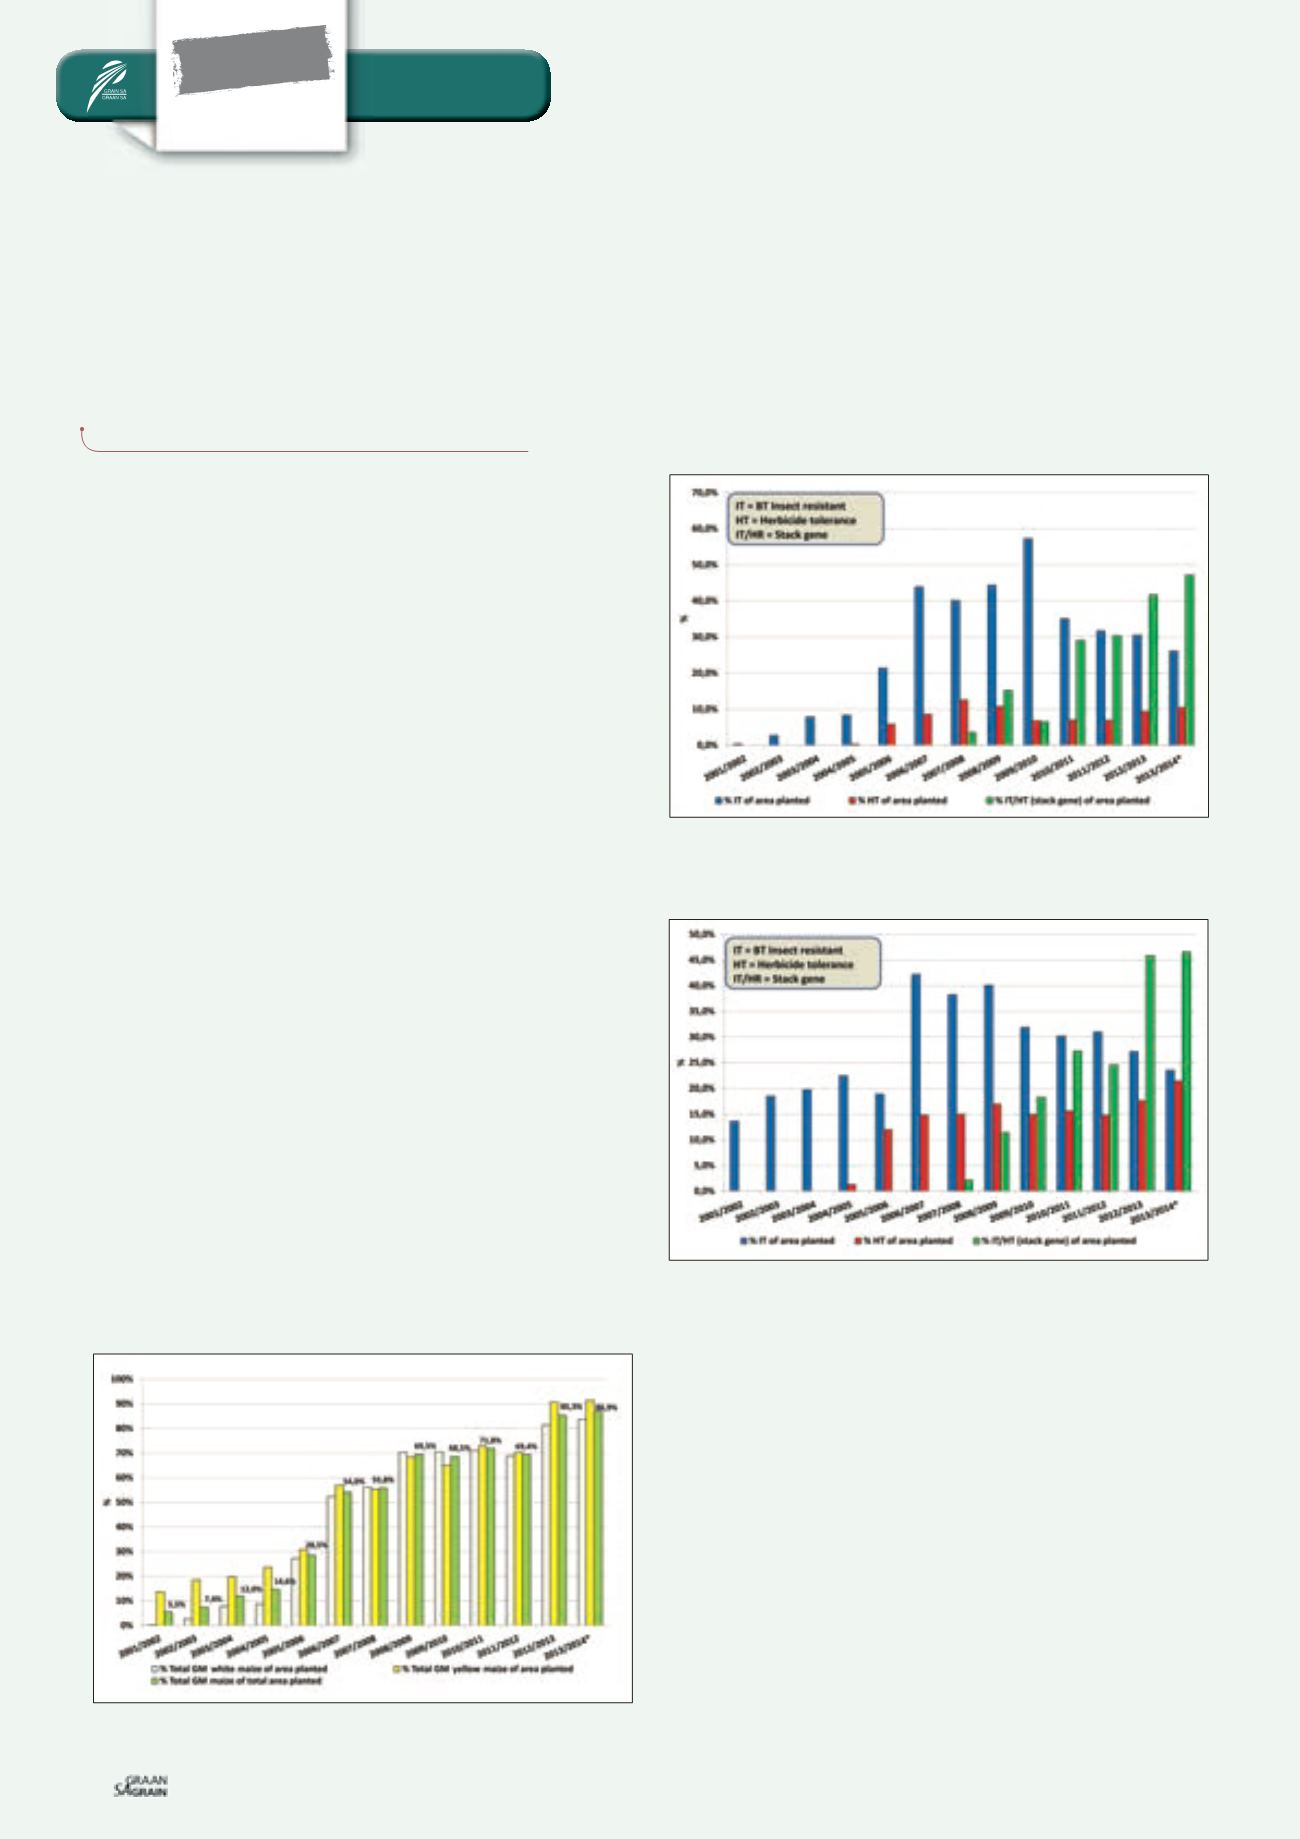
Graph 1
summarises the percentage area
planted under GM white and yellow maize in South Africa since the
2001/2002 production season.
Graph 2
and
Graph 3
illustrates the adoption of each of the differ-
ent traits (insect resistance [Bt], herbicide tolerance [RR] and stacked
for both) separately for white and yellow maize. Three main trends
emerged from these two graphs: Firstly, that the start of adoption
of biotech is very similar for white and yellow maize; secondly, that
the adoption of the different traits (Bt, RR, Bt/RR) is also relatively
similar for white and yellow; and, thirdly, that the adoption of Bt
reached saturation.
Long-term South African maize yield
Graph 4
shows a three year moving average of South Africa’s
maize yield from 1923/1924 to 2013/2014. Maize yield growth from
1923/1924 up to 1960 was rather slow where after it started to in-
crease slightly. The main focus point of this graph is the dramatic
increase in the yield from the 2001/2002 production season to the
2013/2014 production season which is the time period GM crops was
introduced in South Africa.
Graph 1: Percentage GM white and yellow maize of total area planted.
Source: FoodNCropBio, 2014
Graph 2: Percentage insect resistance, herbicide tolerance and stack gene
of total area planted to white maize.
Source: FoodNCropBio, 2014
Graph 3: Percentage insect resistance, herbicide tolerance and stack gene
of total area planted to yellow maize.
Source: FoodNCropBio, 2014
44
Maart 2015