


 47 / 124

2015/IMAIZE/A/05A
www.pannar.com infoserve@pannar.co.za® Geregistreerde handelsmerke van PANNAR BPK, © 2014 PANNAR BPK
Saam boer ons
vir die toekoms
™
Kies PANNAR se besproeiingsbasters vir buitengewone
resultate. Ons bied ook ’n verskeidenheid praktiese
boerderyoplossings en koste-effektiewe bestuur-
praktyke. Ons YIELDBOOST
™
swam- en
insekdoderspuitprogramme bied byvoorbeeld ’n
omvattende koste-effektiewe risikobestuurspakket
om die beste moontlike winspotensiaal vir jou
onderneming te bied.
Boere wat die
beste verwag,
kies die beste.
ULTRAMODERNE
NAVORSINGEN
ONTWIKKELINGSTEGNOLOGIE
GEWASVOORSORG
PRESISIE-
BEPLANNING
GEWASBESKERMINGS-
BESTUURSPRAKTYKE
45
The increase in yield during that time period can not only be attri-
buted to the new genetics in the maize seed, but also to the change in
the marketing system, higher potential soils, irrigation, the increase
in fertiliser application rates and precision agriculture.
Rate of yield gain
As mentioned, South Africa was one of the first countries in Africa to
commercially produce genetically modified crops and ranks eighth
in the world in terms of the sum of combined hectares planted with
maize, soybeans and cotton.
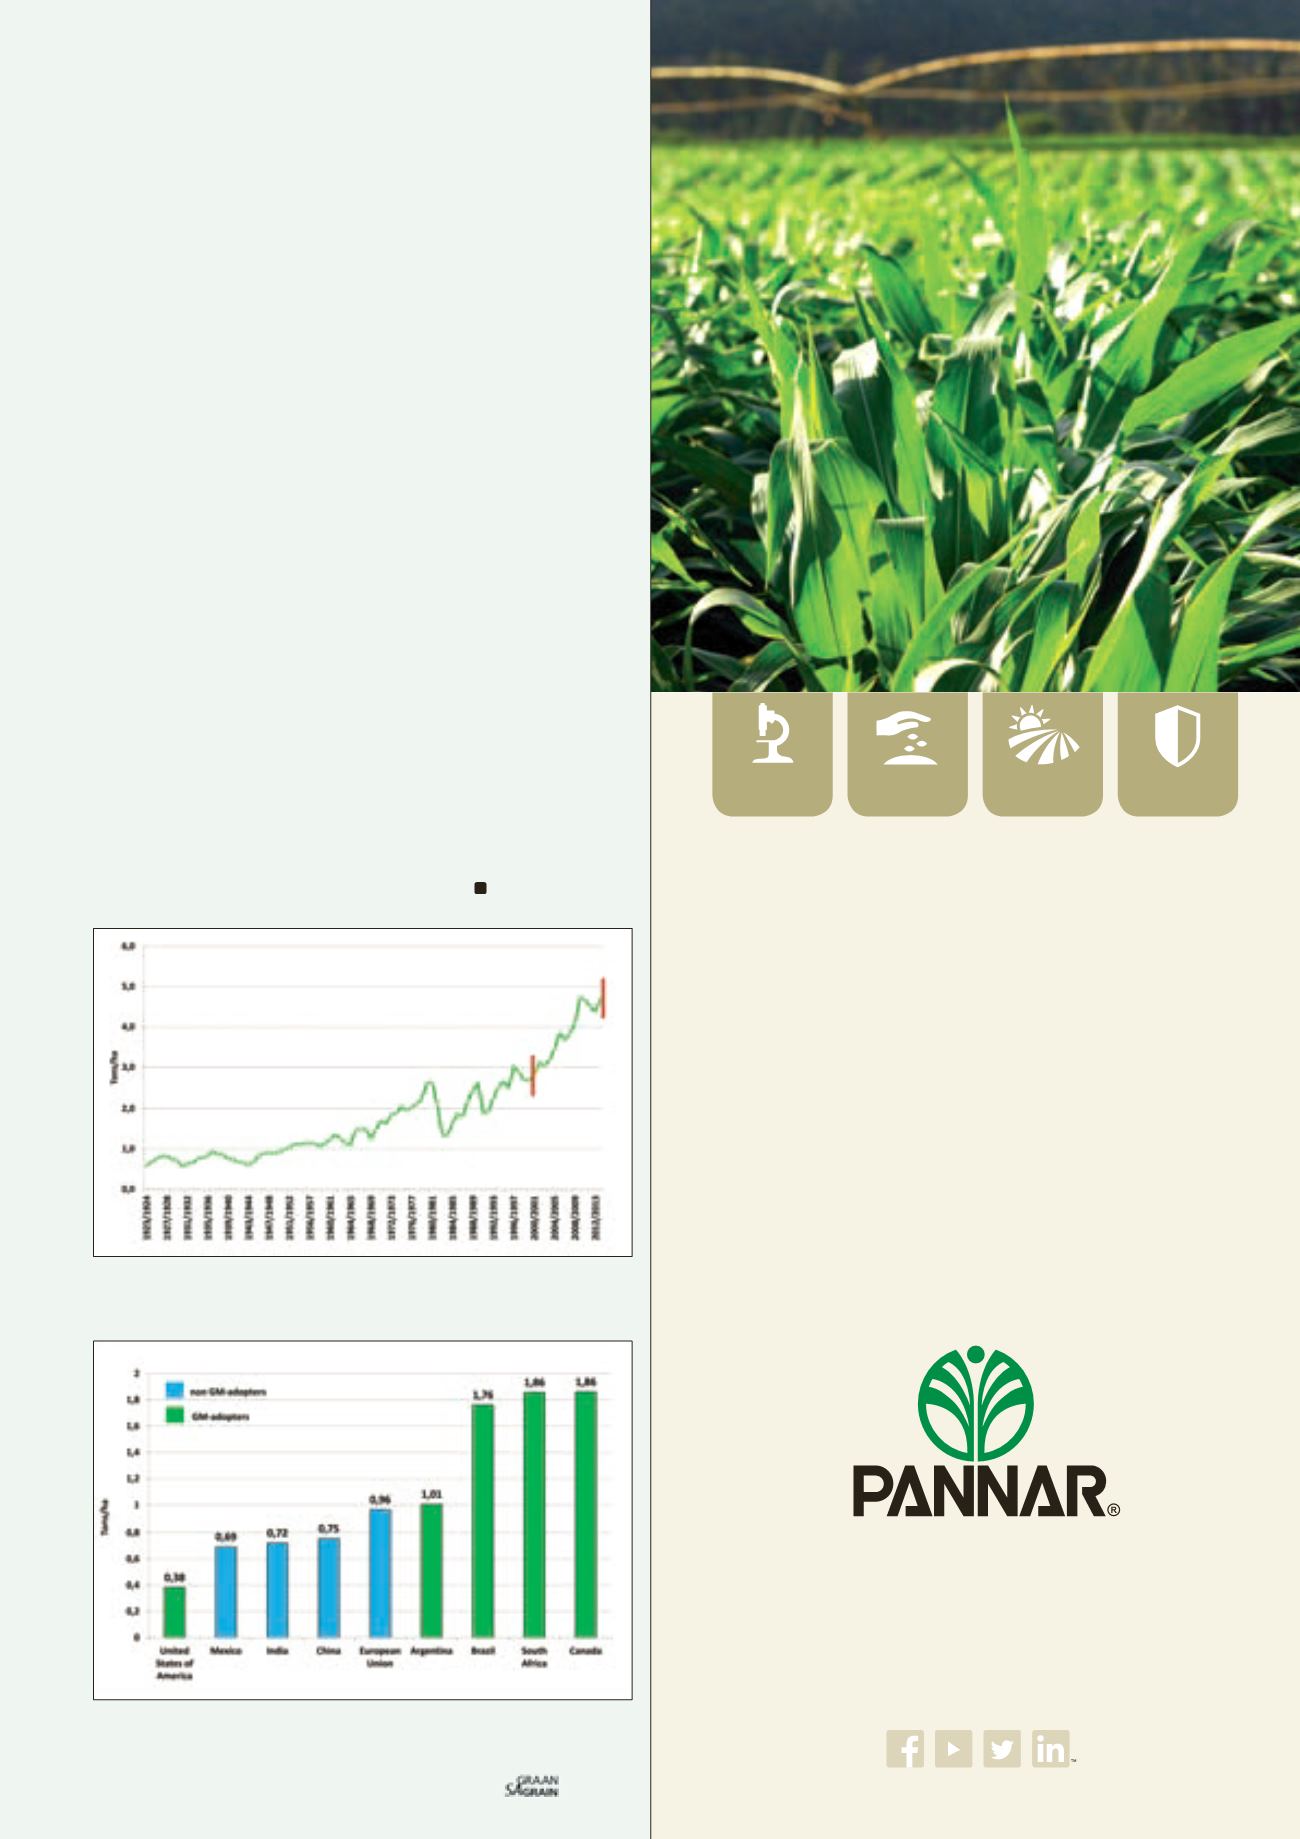
When South Africa’s “rate of yield gain” is compared to other coun-
tries (GM-adopters and non GM-adopters), one can see that South
Africa did fairly good in terms of “yield gain” from 2000 to 2012. The
rate of yield gain was calculated by making use of FAOSTAT’s data
and using a three month moving yield average for the year 2000
(average yield from 1998 to 2000) and 2012 (average yield from
2010 to 2012).
These average yields were subtracted and are depicted in
Graph 5
.
Two main points occurred from this graph; firstly, it is very surpris-
ing to note the small yield gain of the USA during this time period;
secondly, the yield gain in general was higher for the GM-adopter
countries in comparison with the non GM-adopters.
Note: Yield improvements are not only attributed to genetics, but
also management and the environment (biotic and abiotic), as well
as the interactions between these components.
Graph 4: Long-term maize yield for South Africa.
Source: Crop Estimates Committee and own calculations
Graph 5: National average rate yield gain of maize (2000 - 2012).
Source: FAOSTAT, 2014