


 13 / 44

11
December 2015
GRAIN SA ESTIMATE LOWER YIELDS AVERAGE YIELDS ABOVE AVERAGE
Updated
28 OCT
28 OCT
28 OCT
28 OCT
Marketing year
2015/2016*
2016/2017**
2016/2017**
2016/2017**
Area planted (x 1 000 ha)
1 448
1 422
1 422
1 422
Yield (t/ha)
3,25
2,95
4,00
4,25
CEC crop estimate ('000 ton)
4 703
4 194
5 687
6 043
Retentions
110
110
110
110
Minus: Early deliveries (current season)
175
175
175
175
Plus: Early deliveries (next season)
200
200
200
200
Available for commercial deliveries
4 618
4 109
5 602
5 958
Grain SA
Grain SA
Grain SA
Grain SA
('000 ton)
('000 ton)
('000 ton)
('000 ton)
Commercial supply
Opening stocks (1 May)
1 283
1 017
1 017
1 017
Commercial deliveries
4 618
4 109
5 602
5 958
Surplus (adjustment of the reconciliation)
Imports
70
130
0
0
Total commercial supply
5 971
5 256
6 619
6 975
Commercial demand
Commercial consumption
Food
4 200
4 200
4 200
4 200
Feed
100
100
1 000
590
Total
4 300
4 300
5 200
4 790
Other consumption
Gristing
35
35
35
35
Withdrawn by producers
30
30
30
30
Released to end consumers
25
25
25
25
Net receipts
14
14
14
14
Deficit
Total
104
104
104
104
Total SA consumption (commercial)
4 404
4 404
5 304
4 894
Exports
Products
80
80
80
80
Whole maize
470
470
600
1 400
Total exports
550
550
680
1 480
Total commercial demand
4 954
4 954
5 984
6 374
Carry-out (30 April)
1 017
302
635
601
Pipeline requirements (1,5 months)
538
538
650
599
Surplus above pipeline
479
-235
-15
2
Carry-out as a % of SA consumption
23,09%
6,86%
11,97%
12,27%
Carry-out as a % of total commercial demand
20,52%
6,10%
10,61%
9,42%
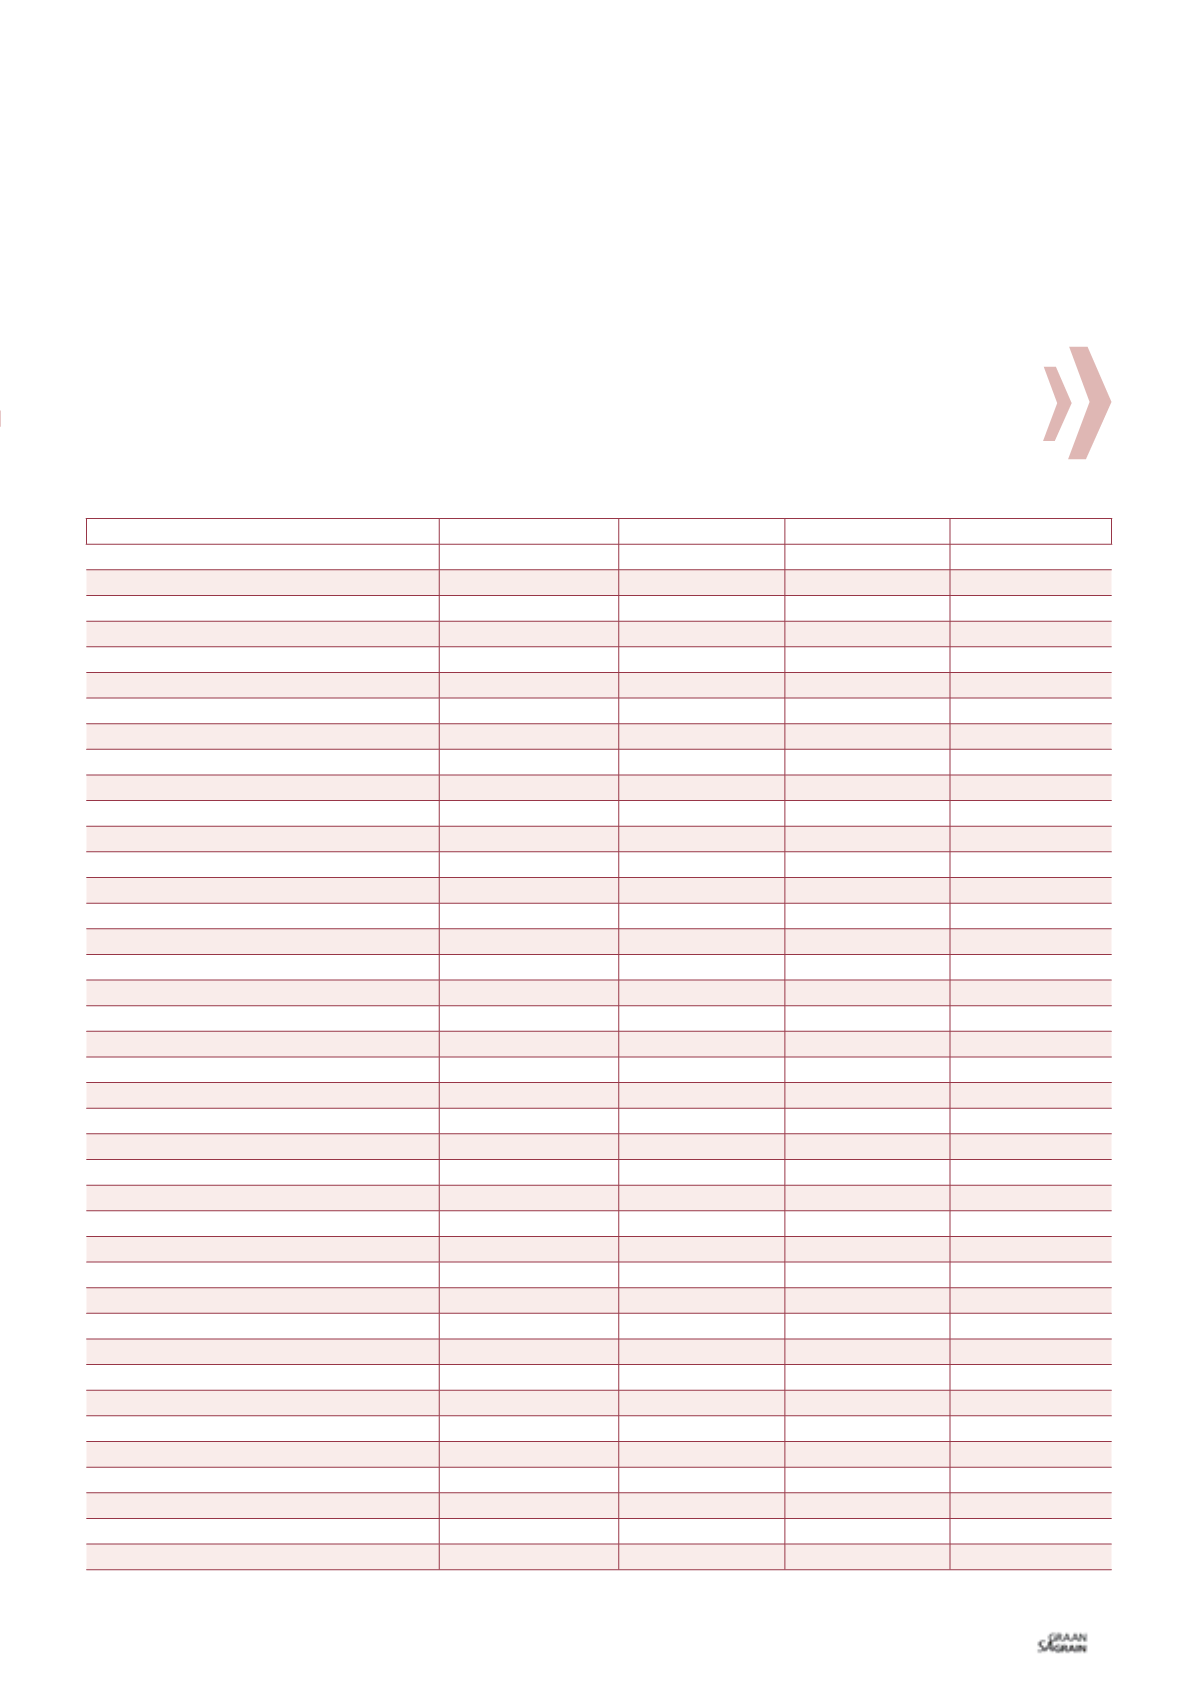
TABLE 1: SOUTH AFRICA’S 2015/2016 WHITE MAIZE SUPPLY AND DEMAND ESTIMATES AND 2016/2017 SCENARIOS (
'
000 TONS).
*Grain SA estimate
**Grain SA scenarios
Lower yields scenario
White maize
In the event of below normal rainfall, South African producers might
achieve a national average yield of 2,95 t/ha. The National Crop
Estimates Committee’s (CEC) intentions-to-plant data shows that
producers might plant 1,42 million hectares of white maize. This
would then lead to a total production of 4,19 million tons. Assuming
that domestic consumption remains constant due to higher prices
and exports would only be for Botswana, Namibia, Lesotho and Swa-
ziland (BNLS countries), South Africa would have to import
130 000 tons of white maize to meet the domestic demand (Table 1).
Yellow maize
In the event of below normal rainfall, South African producers might
achieve a national average yield of 3,50 t/ha. The CEC’s intentions-
to-plant show that producers might plant 1,12 million hectares to
yellow maize. This would then lead to total production of 3,9 million
tons. Assuming that domestic consumption would slightly increase
on the back of an increase in the livestock industry and exports will
just be for the BNLS countries, South Africa would have to import
2,27 million tons of yellow maize to meet the domestic demand
(see Table 2).
Total maize imports
Total maize imports of 2,4 million tons would cost the South Afri-
can economy ± R8 billion. This would have a negative effect on the
economy, resulting in a widening current account deficit and possi-
ble influence the exchange rate movements. South Africa’s economy
needs capital inflows to finance the current account deficit, thus any
significant outflows would be negative for the economy.
Average yields scenario
White maize
In the event of normal rainfall, South Africa might achieve a national
average yield of 4 t/ha. The CEC’s intentions-to-plant show that pro-
ducers might plant 1,42 million hectares to white maize.