


 15 / 44

13
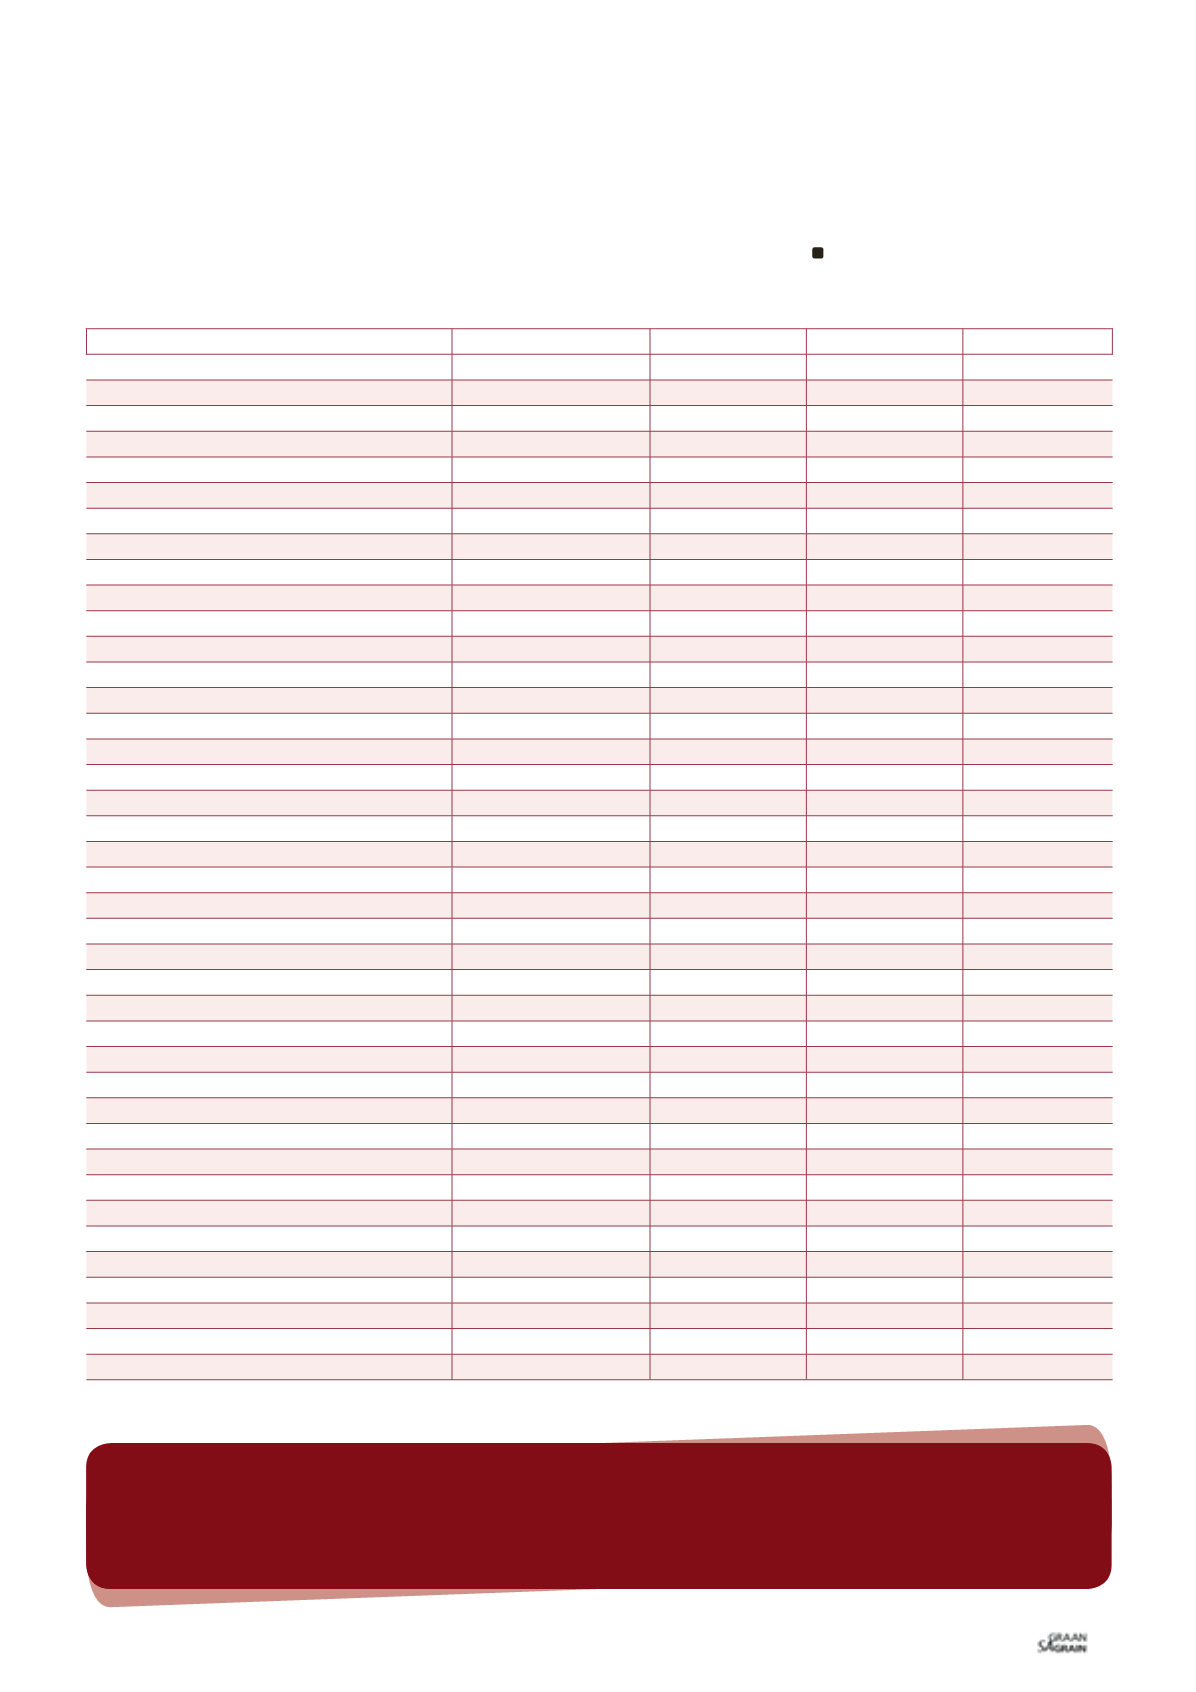
*Grain SA estimate
**Grain SA scenarios
GRAIN SA PROJECTION LOWER YIELDS AVERAGE YIELDS ABOVE AVERAGE
Updated
28 OCT
28 OCT
28 OCT
28 OCT
Marketing year
2015/1206*
2016/2017**
2016/2017**
2016/2017**
Area planted (x 1 000 ha)
2 653
2 551
2 551
2 551
Yield (t/ha)
3,75
3,19
4,22
4,53
CEC crop estimate ('000 ton)
9 942
8 146
10 768
12 026
Retentions
500
500
500
500
Minus: Early deliveries (current season)
Plus: Early deliveries (next season)
Available for commercial deliveries
9 442
7 646
10 268
11 526
Grain SA
Grain SA
Grain SA
Grain SA
('000 ton)
('000 ton)
('000 ton)
('000 ton)
Commercial supply
Opening stocks (1 May)
2 074
1 466
1 466
1 466
Commercial deliveries
9 420
7 624
10 246
11 504
Surplus (adjustment of the reconciliation)
Imports
770
2 406
500
Total commercial supply
12 264
11 496
12 211
12 970
Commercial demand
Commercial consumption
Food
4 620
4 620
4 620
4 620
Feed
5 000
5 196
5 096
5 090
Total
9 620
9 816
9 716
9 710
Other consumption
Gristing
47
47
47
47
Withdrawn by producers
105
105
105
105
Released to end consumers
185
185
185
185
Net receipts
31
31
31
31
Deficit
Total
368
368
368
368
Total SA consumption (commercial)
9 988
10 184
10 084
10 078
Exports
Products
180
180
180
180
Whole maize
630
630
760
1 560
Total
810
810
940
1 740
Total commercial demand
10 798
10 994
11 024
11 818
Carry-out (30 April)
1 466
502
1 187
1 152
Pipeline requirements (1,5 months)
1 203
1 227
1 215
1 214
Surplus above pipeline
263
-725
-27
-62
Carry-out as a % of SA consumption
14,67%
4,92%
11,78%
11,43%
Carry-out as a % of total commercial demand
13,57%
4,56%
10,77%
9,75%
Disclaimer
Everything has been done to ensure the accuracy of this information,
however Grain SA takes no responsibility for any losses or damage incurred
due to the usage of this information.
TABLE 3: SOUTH AFRICA’S 2015/2016 TOTAL MAIZE SUPPLY AND DEMAND ESTIMATES AND 2016/2017 SCENARIOS (
'
000 TONS).
December 2015
Concluding remarks
The discussion briefly presented possible future scenarios in the
South African maize market, prefaced by the importance of the maize
industry and its export earnings to the South African economy.
Possible scenarios for the 2016/2017 marketing year should be
viewed with caution as they might change in line with weather
changes and revision in the CEC’s area planted estimates. The sce-
narios were mainly presented for information purposes to assist
producers and other industry stakeholders to plan ahead, should
conditions favour any of the above mentioned scenarios.
The updates of these scenarios will be available on Grain SA’s web-
site at
www.grainsa.co.za.