
63
August 2017
of the summer grain and oilseed crops.
New records in terms of production were
seen with the largest maize and soybean
crops ever recorded in South Africa.
According to the CEC the maize crop for the
season in estimated to be 15,6 million tons,
which leaves South Africa with an export-
able surplus of maize of around 4,1 million
tons for the season. The pace of the exports
will play a key role in the carry-over stocks
of maize at the end of the marketing season.
This can have a significant influence on the
maize prices for the new season.
One of the biggest issues amongst grain
producers is what the situation would be
like next year and what alternatives can be
considered when doing crop planning for
the new season.
One of the main decision variables that
needs to be considered is the profitability
of the enterprise for the season. Producers
need to make their calculations to determine
which crop or combination of crops will be
the most profitable and take their decisions
accordingly.
An angle that can be of use to producers
in order to take decisions is by making use
of price ratio calculations. The price ratios
provide an excellent overview of the rela-
tionship between the prices of the com-
modities.
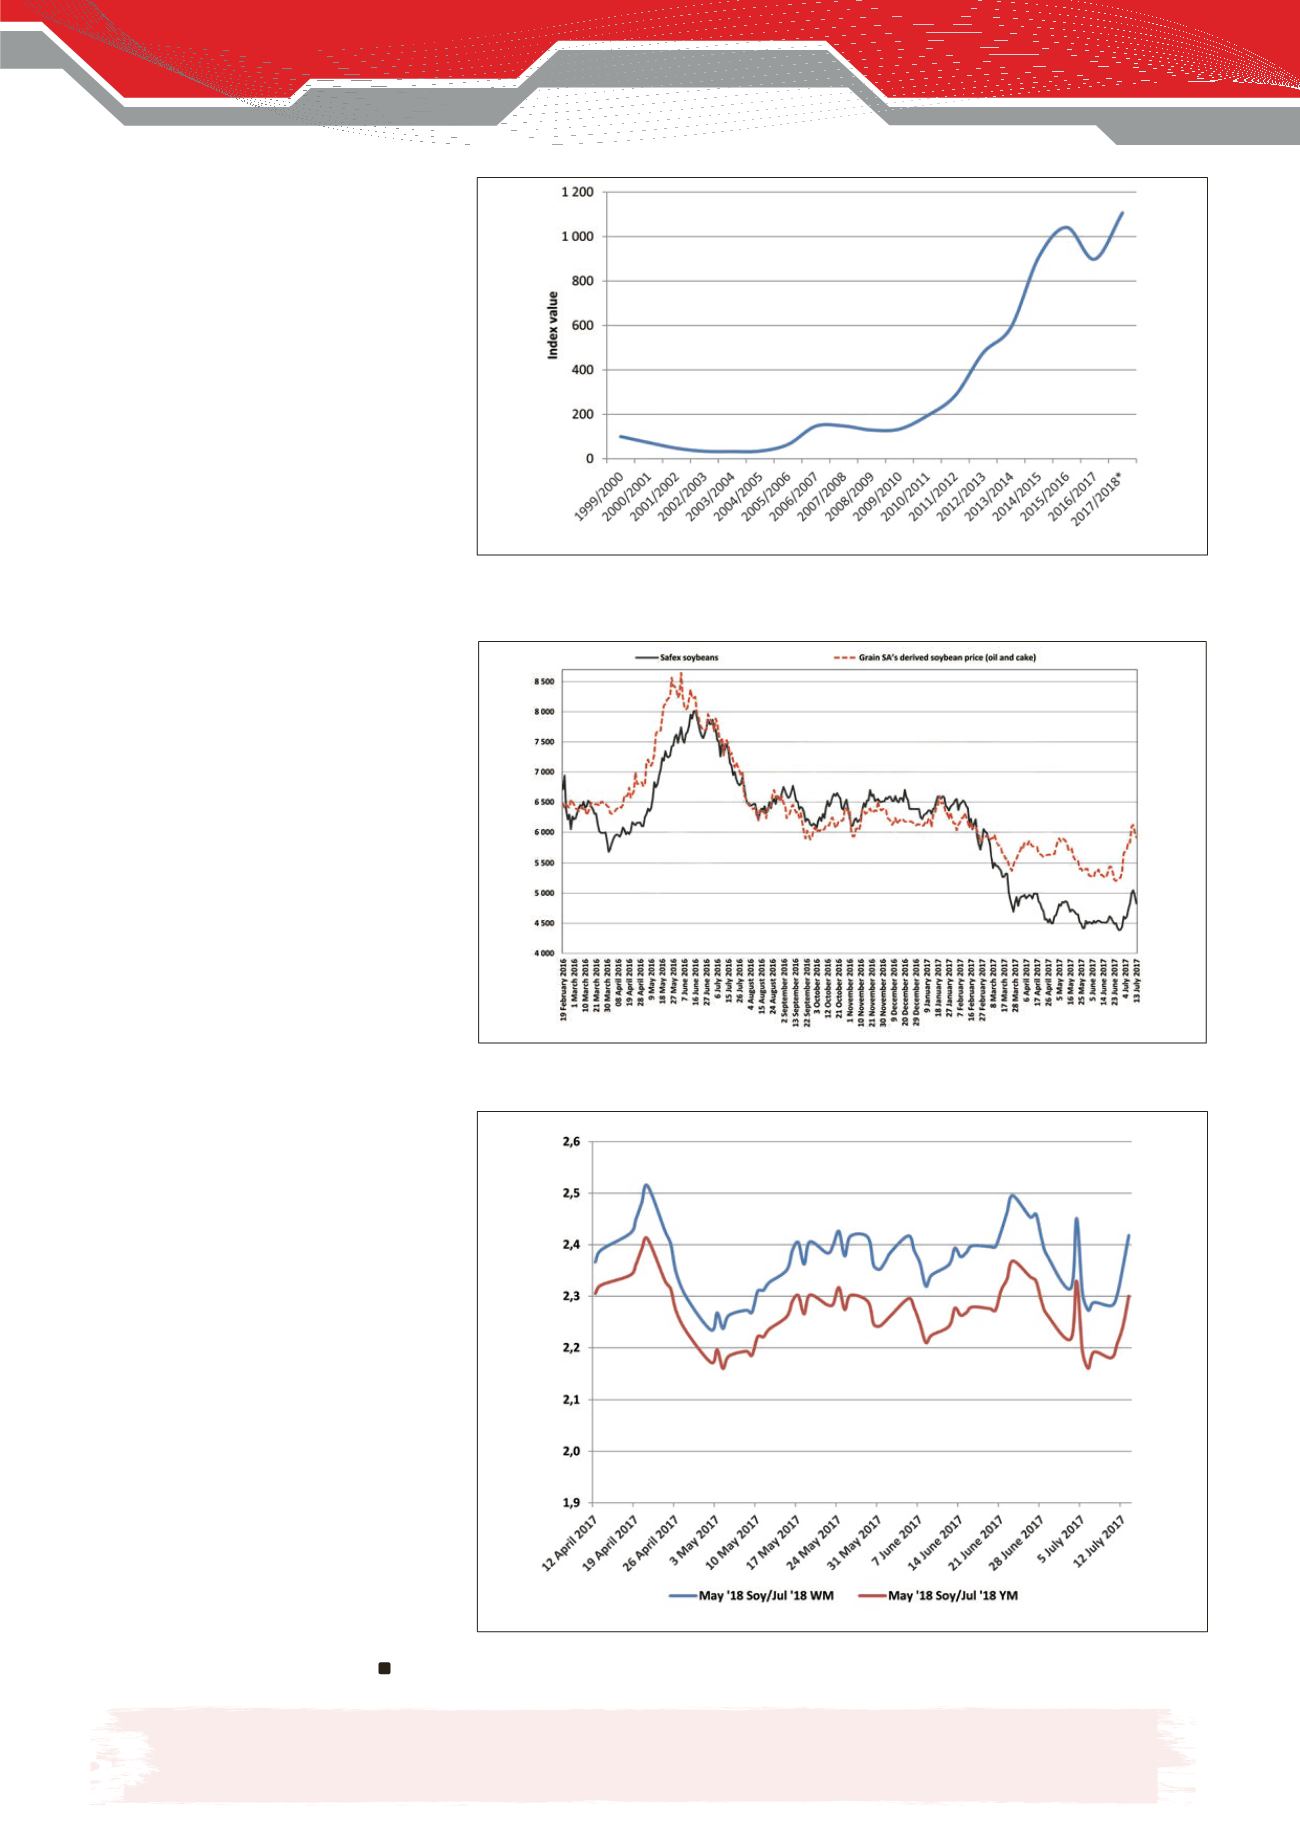
Graph 4
indicates the price ratios between
maize for delivery in July 2018 and soybeans
for delivery in May 2018. On average the
soybean prices need to be between 1,8 to
two times higher than that of maize across
the country to break even – depending on
the cost structures and yields in the differ-
ent regions. It is clear from Graph 4 that
the soybean prices for delivery in May 2018
are almost 2,3 times higher than July 2018
yellow maize prices and 2,4 times higher
than the July 2018 white maize prices from
early April 2017.
In conclusion
The exceptional production of most sum-
mer grains and oilseeds that was seen this
season filled the producers with gratitude
– especially after the previous difficult sea-
son. The good yields and large crops did,
however, have a huge negative impact on
the prices, which still place the profitability
of producers under pressure.
Proper planning will be essential for the
new season. This includes cost calculations,
proper crop planning as well as marketing
alternatives and utilisation of hedging strat-
egies to minimise further price risk.
Graph 2: Soybeans crushed for oil and oilcake on an index basis.
Source: SAGIS and own calculations
*Grain SA projection
Graph 3: Derived prices for soybean delivered in Randfontein.
Source: Grain SA
Graph 4: Price ratios of soybeans and maize for delivery in May and July 2018.
Source: Safex and own calculations
Disclaimer
Everything has been done to ensure the accuracy of this information, however Grain SA takes no responsibility for any
losses or damage incurred due to the usage of this information.


