
Augustus 2017
62
o
ver the past 20 years, the con-
sistent improvements in soy-
bean production have steadily
improved the competitive posi-
tion of soybeans among other
arable crops, with soybeans that
cover over 62% of the global oilseed pro-
duction. Consequently global oilseed pro-
duction has been growing since the 1980s.
Moreover, it showed a more rapid growth
trend since 2012.
Over the past ten years, global soybean
production rose by 61%, from 218 mil-
lion tons in 2007/2008 to 352 million in the
2016/2017 marketing season. The key driv-
ers in the increasing soybean production
are the United States of America, Brazil
and Argentina.
Consequently, there was a matched rise in
the world ending stocks. According to the
latest World Agricultural Supply and De-
mand Estimates (WASDE) report the world
ending stocks of soybeans are projected to
be 93,53 million tons for the 2017/2018 mar-
keting season, which is equal to about 80%
of the record crop produced by the US in
2016.
A noticeable trend in agricultural markets
is that ample stocks lead to subdued prices
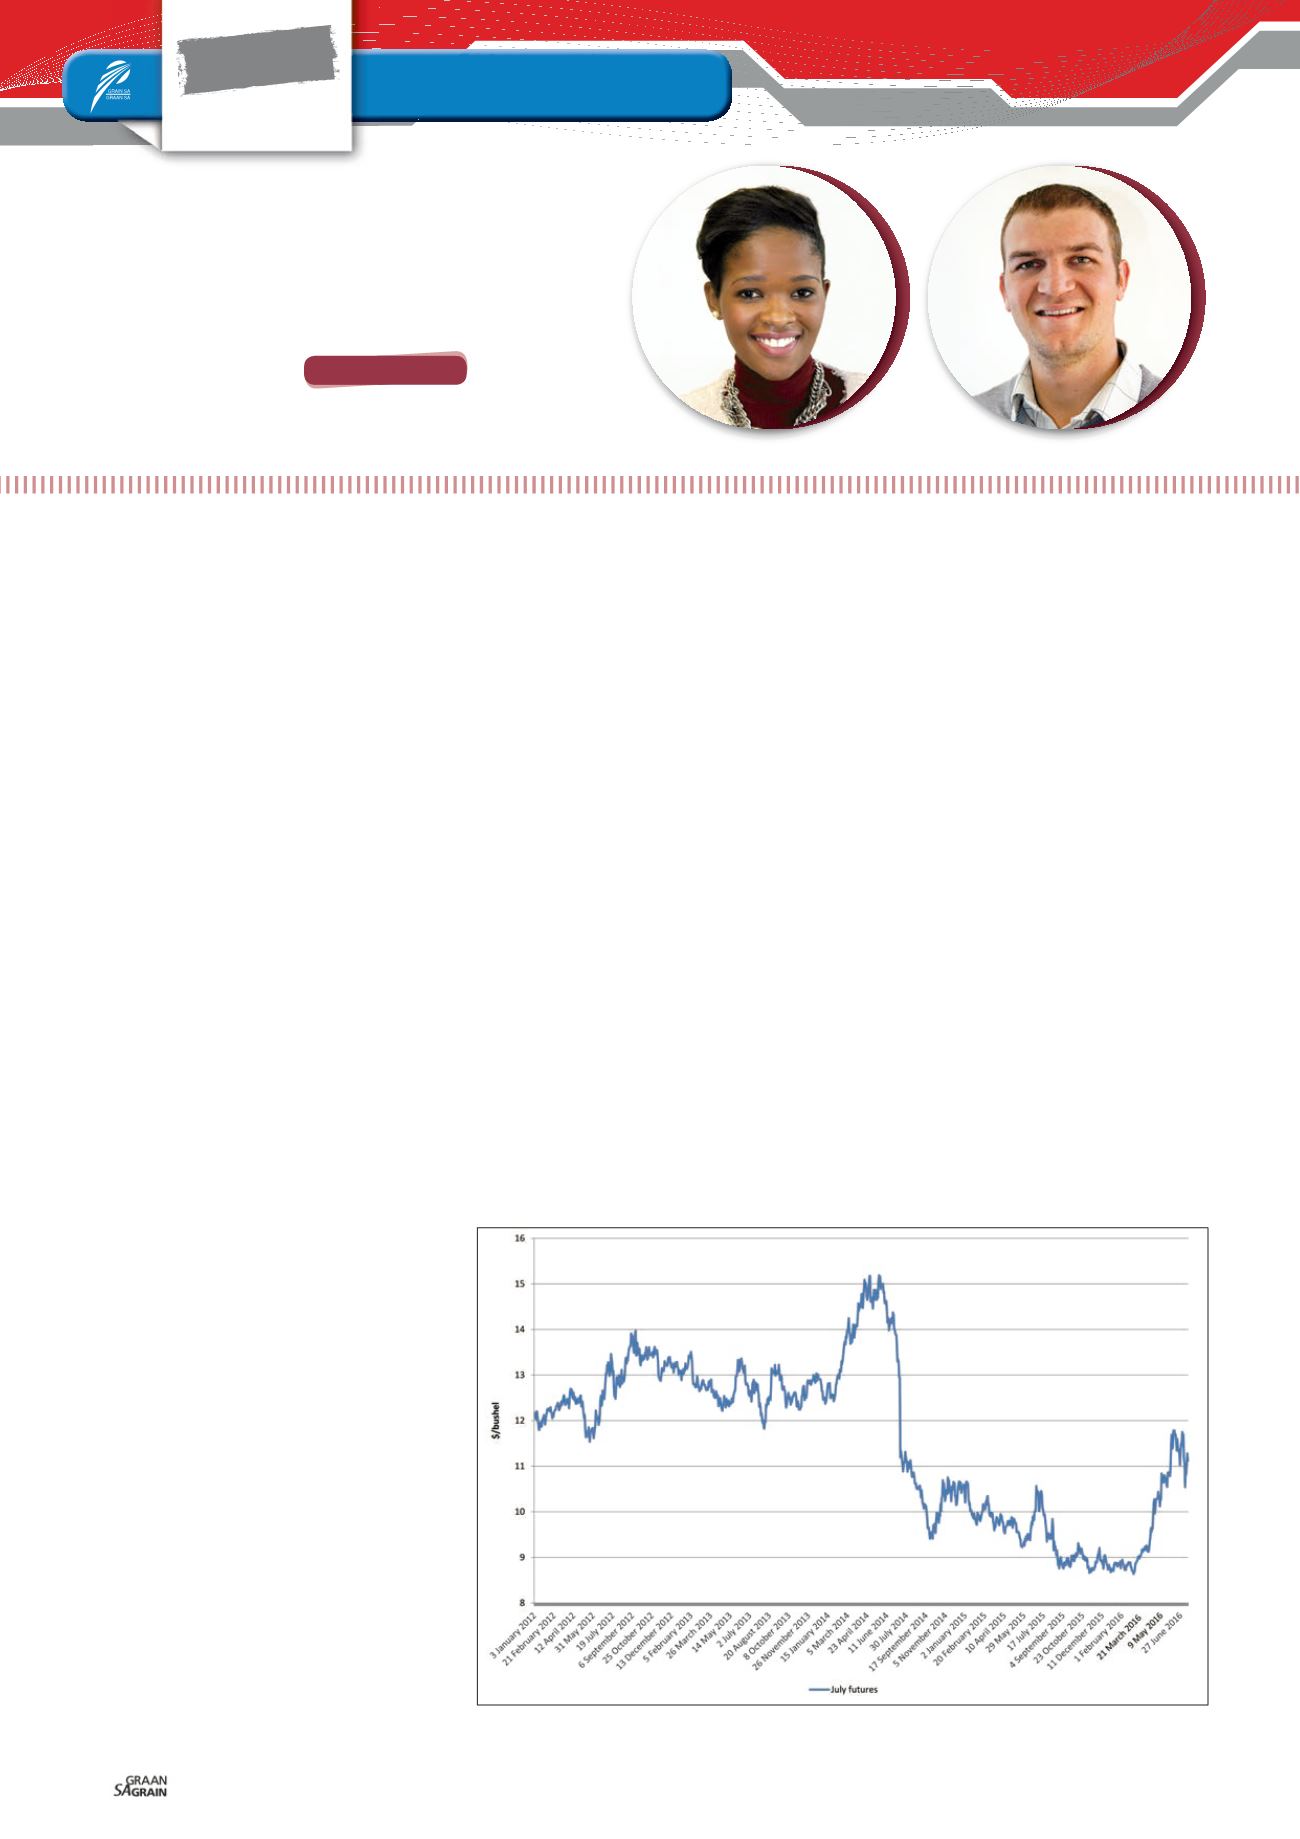
over time. In the past two years, the CBOT
soybean prices were trading at the low-
est levels since 2012, with limited price
gains at the back of large carryover stocks,
which placed pressure on the international
soybean prices (
Graph 1
).
Overview of local
soybean trends
Looking at the recent soybean production
figures in the South African market, one
can conclude that the local market presents
a similar trend to the international one with
good growth in production that was seen
from 2012 onwards.
According to the National Crop Estimates
Committee’s (CEC) fifth production forecast
for the 2017/2018 marketing season, South
Africa is likely to harvest an all-time record
soybean crop of 1,34 million tons.
The crushing of soybeans also showed
some good growth over the recent few
years.
Graph 2
shows the local soybean
crushing per marketing year on an index
basis with the 1999/2000 marketing year
as the base year. It is clear that soybean
crushing increased with more than 1 000%
from the base year and the local crushing of
soybeans is estimated to reach just over
1 million tons for the season.
The local soybean prices have been under
pressure since the harvesting has start-
ed, but found some good support lately.
Graph 3
shows the local soybean price
and the derived soybean price. The derived
price is a calculated price of what it will
cost to import the two by-products from
crushing soybeans namely soybean oil
and oilcake.
When the local price is trading below the
derived price and the crushing margin is
positive, the crushers will tend to crush
more soybean locally, which is positive for
the local demand of soybeans. When the
local price is higher than the derived price,
the crushers will tend to crush less soy-
beans locally since it is then cheaper to im-
port the oil and oilcake separately.
Currently the local prices are still well below
the derived price and the crushing margin
is positive. In the latest monthly SAGIS
figures the soybean crushing for May was
reported to be 11 285 tons more than the
three-year average for May.
New season outlook
The current marketing year was an excep-
tional year in terms of production for most
FOCUS
Soybeans
Mini
Soybean market outlook
MICHELLE MOKONE,
agricultural economist, Grain SA and
LUAN VAN DER WALT,
agricultural economist, Grain SA
GRAIN MARKET
overview
– 13 July 2017
Graph 1: CBOT soybean prices in $/bushel from 2012 to July 2017.
Source: CME Group


