


 41 / 84

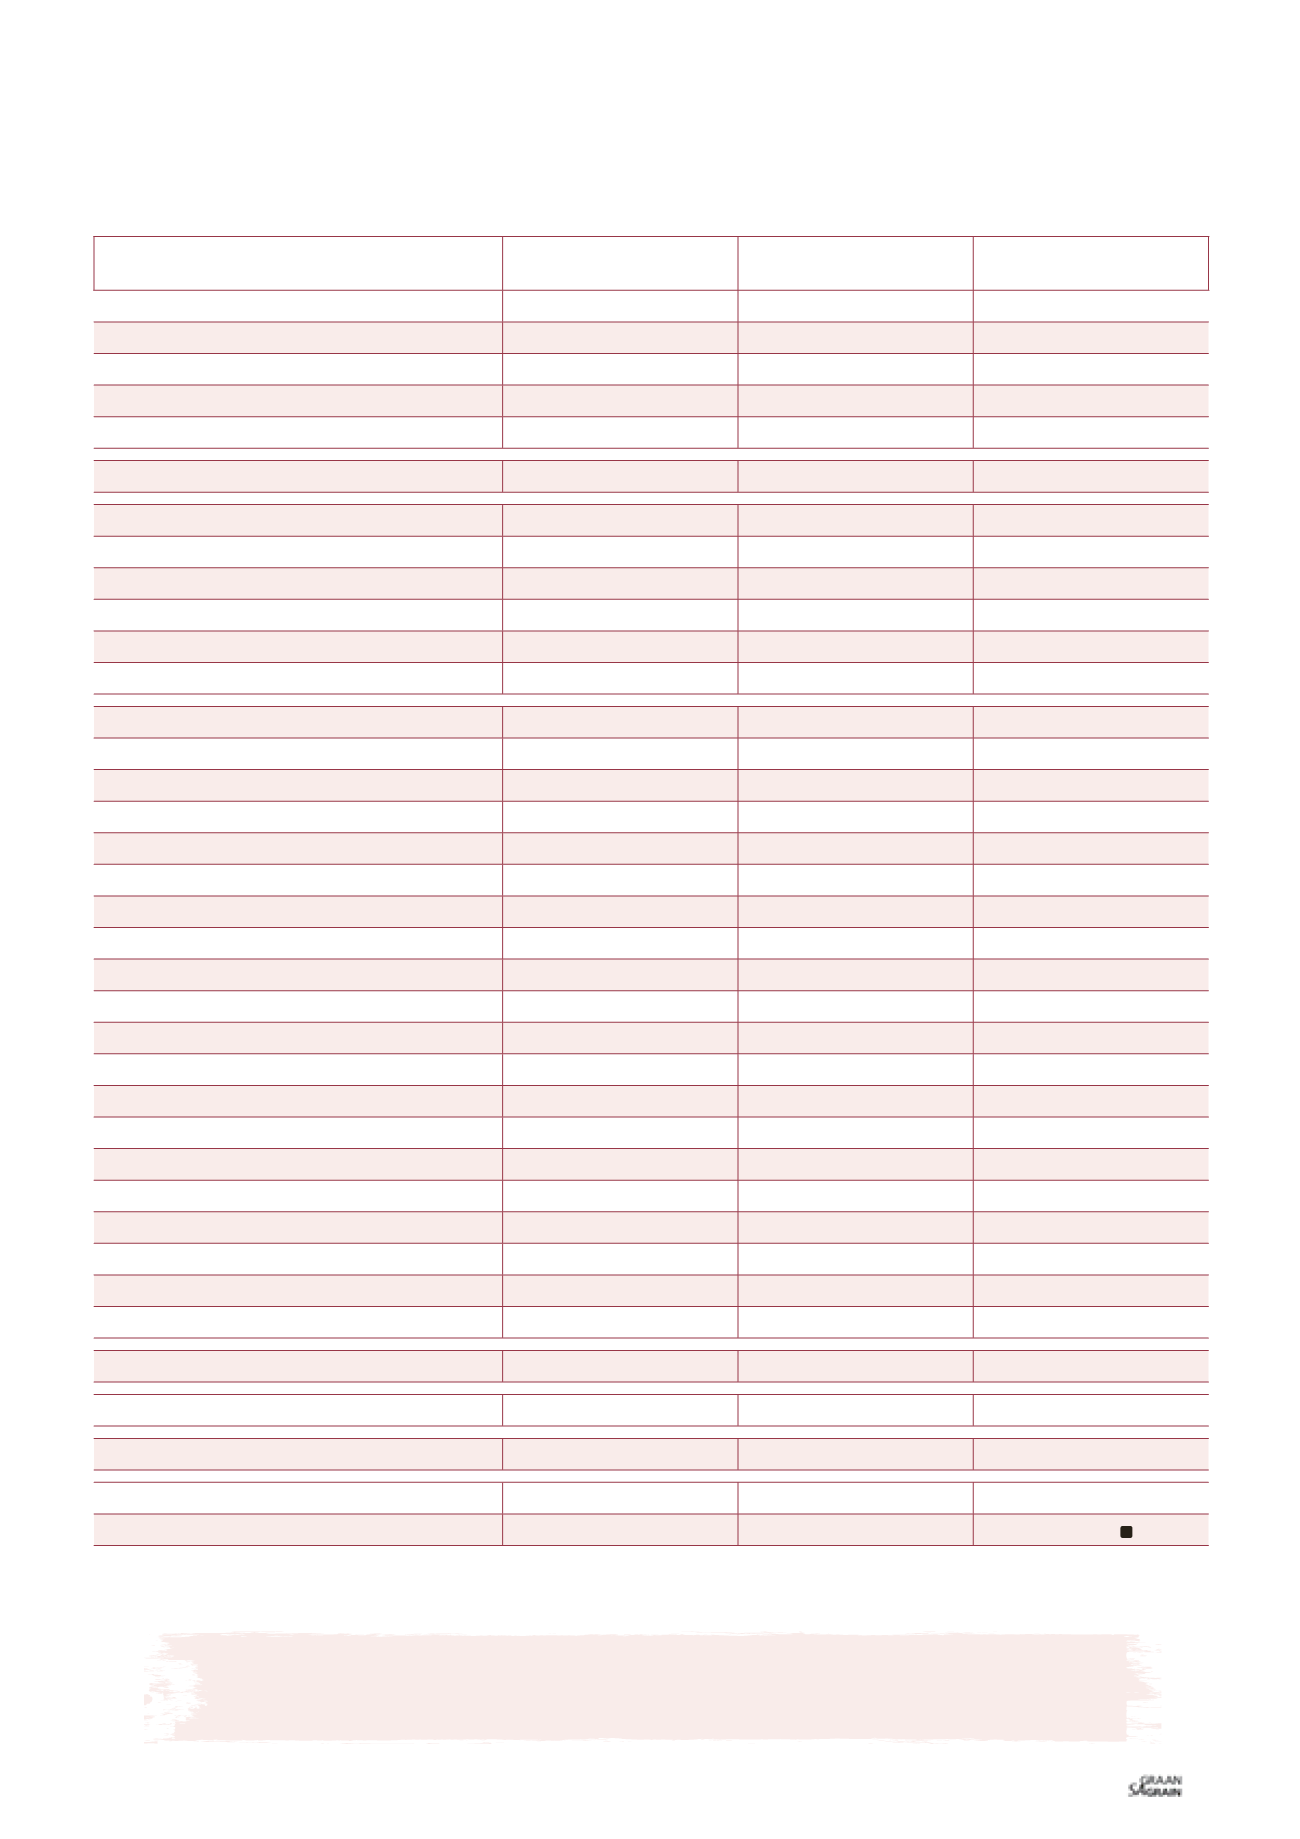
TABLE 2: DETAILED SOUTH AFRICAN SORGHUM SUPPLY AND DEMAND ESTIMATES.
UPDATED 9 MARCH 2016
GRAIN SA PROJECTION
27 FEBRUARY
CEC
’
S VIEW
27 FEBRUARY
Marketing year
2014/2015
2015/2016*
2016/2017**
Area planted (x1 000 ha)
79
71
49
Yield (t/ha)
3,36
1,65
1,93
CEC crop estimate ('000 ton)
265
117
93
Retentions and production of seed
3,70
3,70
3,70
Available for commercial deliveries
261
113
90
Sagis
Grain SA
Grain SA
Commercial supply
Opening stocks (1 March)
50,1
121,8
57,4
Commercial deliveries
261,5
112,8
89,7
Imports
8,7
40,0
60,0
Total commercial supply
320,3
275
207
Commercial demand
Food consumption
Indoor malting
13,7
18,4
13,0
Floor malting
48,5
56,0
50,0
Meal, rice and grits
90,3
95,0
90,0
Total food
152,6
169,4
153,0
Feed consumption
Pet food
1,1
1,1
1,1
Poultry
3,6
5,0
3,7
Other livestock feed
2,1
5,0
1,4
Total feed
6,8
11,1
6,2
Biofuel
0,0
0,0
0,0
Other consumption
Withdrawn by producers
4,7
6,0
5,4
Released to end consumers
2,4
5,2
2,5
Sagis
5,9
0,0
0,0
Total other consumption
13,0
11,2
7,9
Total domestic demand
172,3
191,7
167,1
Exports
26,2
25,5
10,0
Total demand
198,5
217,2
177,1
Carry-over (28 February)
121,8
57,4
30,0
Pipeline requirements
19,1
21,2
19,1
Surplus above pipeline
103
36
11
Carry-over as a % of RSA consumption
70,69%
29,94%
17,95%
Carry-over as a % of total commercial demand
61,37%
26,42%
16,94%
Source: Grain SA
* Grain SA estimates
** Grain SA projections
Disclaimer
Everything has been done to ensure the accuracy of this information, however Grain SA takes no responsibility
for any losses or damage incurred due to the use of this information.
39
April 2016