
43
April 2015
The marketing years suffering the lowest stock levels include
2007/2008, 2011/2012 and 2013/2014.
Early deliveries and imports made a significant contribution to
stock levels. The early deliveries during drought or lower production
seasons were 212 000 tons (2004/2005), 550 000 tons (2006/2007)
and 668 000 tons (2007/2008). Grain SA used a five-year average
early delivery figure of 490 000 tons for March and April 2015/2016
in determining the import need of 934 000 tons.
The early deliveries went as low as 91 000 tons in 2005/2006 and
increased as high as 842 000 tons in 2012/2013. There is no signifi-
cant correlation between the early delivery figure and the ultimate
production volumes for the same marketing year or production sea-
son for the past ten years. The early delivery figure for March and
April each year is thus a total uncertainty.
Imports of 934 000 tons are expected with an early delivery
figure of 489 000 tons. Therefore, if the early deliveries reach only
91 000 tons it is expected that imports may aim at 1 332 000 tons. If
early deliveries reach a figure of 842 000 tons, imports may aim at
only 581 000 tons.
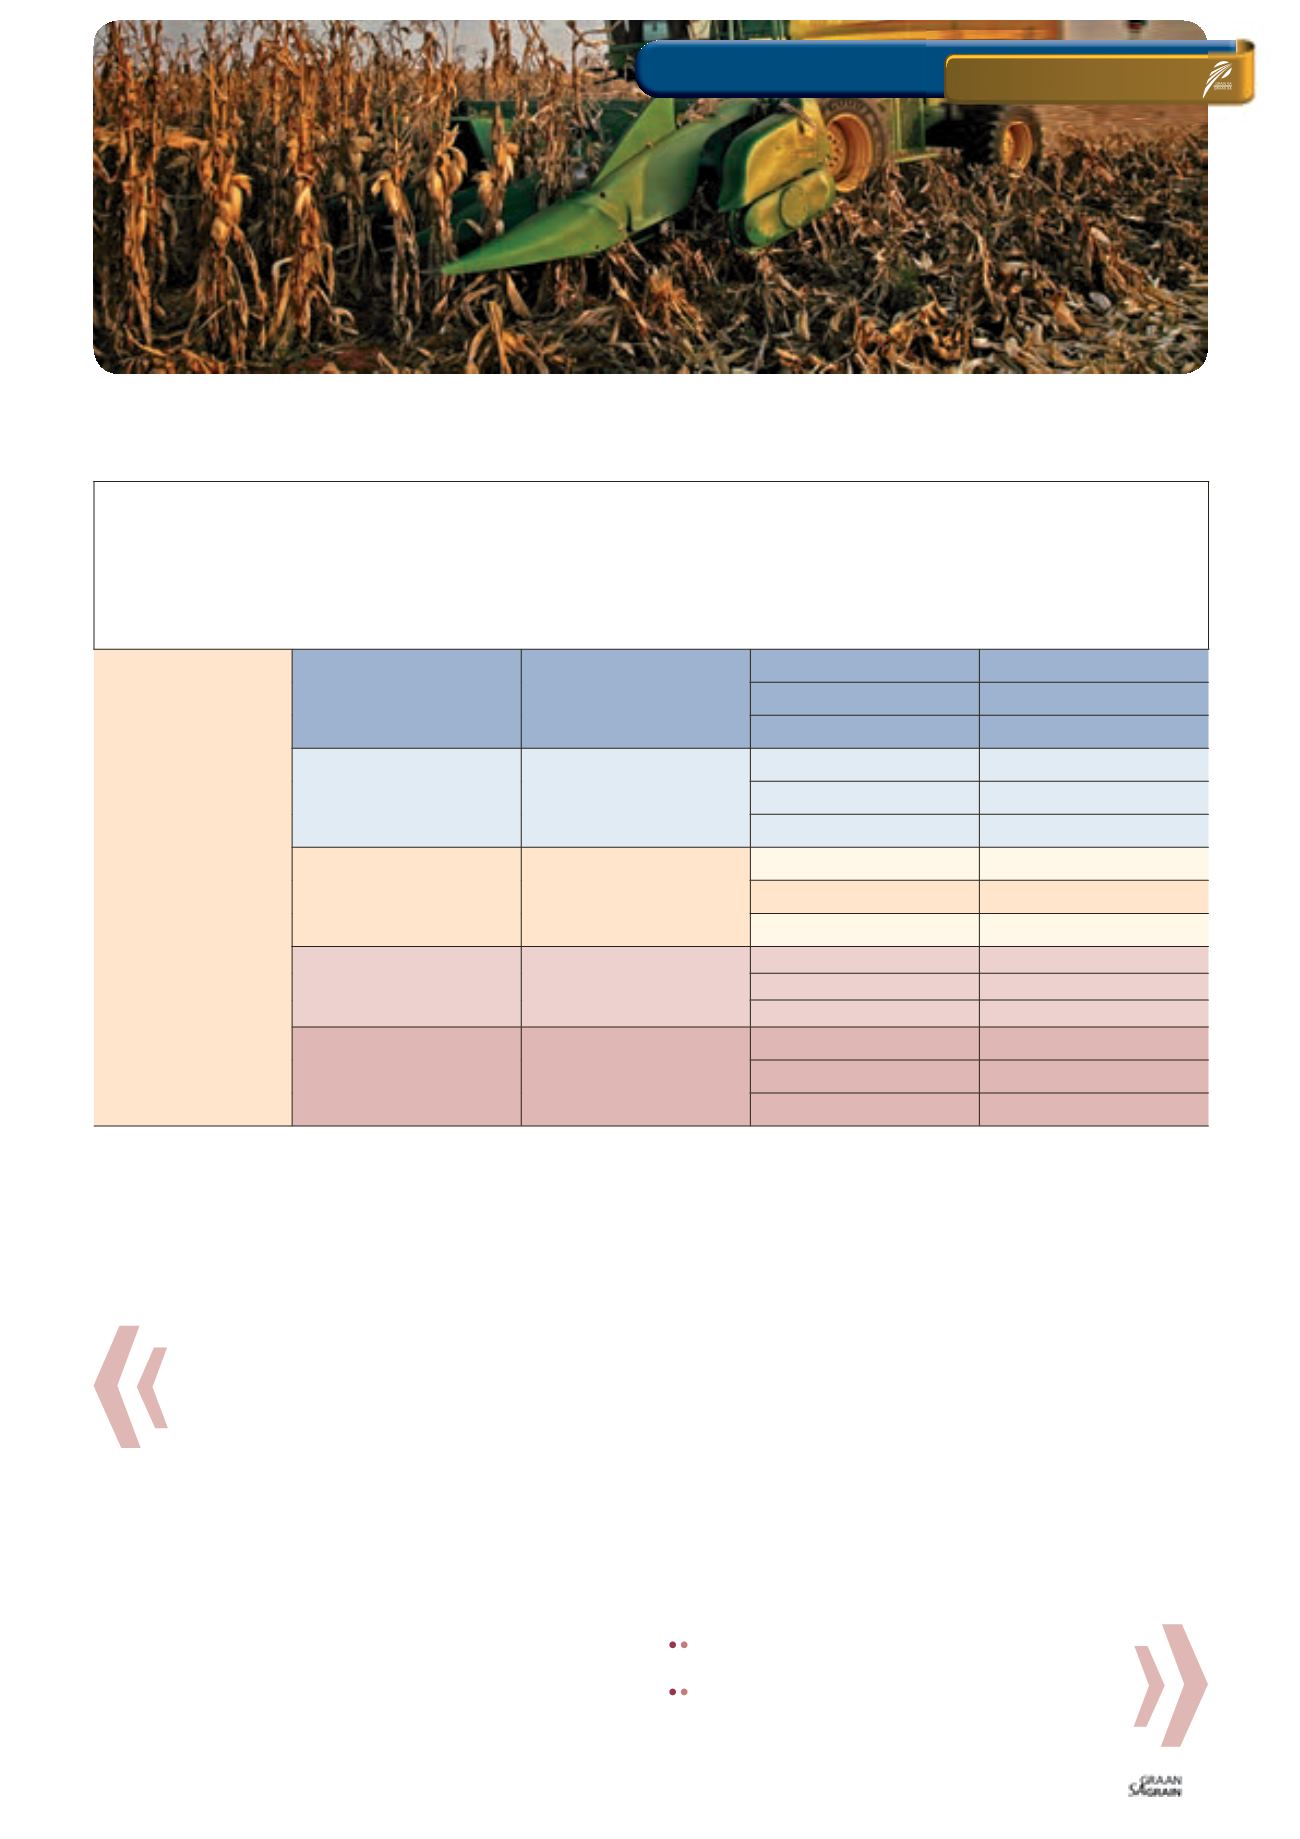
Change in marketing years
Grain SA took the decision to report on supply and demand
factors over a marketing period which stretches from March to Feb-
ruary instead of May to April. (See also our Supply and Demand
estimates in
Table 5
,
Table 6
and
Table 7
.) The main purpose of
the change is to eliminate the impact of uncertain early deliveries
during March and April on the supply and demand of maize.
However, the following needs to be understood:
By changing the reporting period, early deliveries still remain. It
does not disappear.
The pipeline requirement of 45 days, as defined by millers,
stays the same. It does not increase by two months or 60 days
because of the change in the reporting period.
Possible changes in the
crop estimate between
the first production
estimate in February
and reconciliation in
November*
The updated import
need after adjustment
for possible changes
in the crop estimate
between February
and November
(tons)
Adjustment in early
deliveries for March and
April 2016 in case the early
delivery figure changes
from the five year average
of 489 000 ton**
(tons)
Final import need at the
end of April 2016 after
considering possible
changes in crop size
and early deliveries
(tons)
Grain SA projects
an import need of
934 000 tons at a
production level of
9 655 290 tons (first
production estimate)
and early deliveries of
489 000 tons in March
and April 2016.
The crop is underesti-
mated by 8,2% – the crop
estimate increases by
792 051 tons
141 949
317 898
459 847
0
141 949
-352 586
0 (-210 637)
The crop is underesti-
mated by 3,4% – the crop
estimate increases by
331 519 tons
602 481
317 898
920 379
0
602 481
-352 586
249 895
The first production
estimate is correct – the
crop estimate remains
unchanged
934 000
317 898
1 251 898
0
934 000
-352 586
581 414
The crop is overestimated
by 0,48% – the crop de-
creases by 46 393 tons
980 393
317 898
1 298 291
0
980 393
-352 586
627 807
The crop is overestimated
by 3,9% – the crop de-
creases by 376 463 tons
1 310 463
317 898
1 628 361
0
1 310 463
-352 586
957 877
TABLE 4: DIFFERENT SCENARIOS FOR FOLLOW-UP ESTIMATES AND EARLY DELIVERIES.
* During the recent five years the Crop Estimates Committee underestimated the crop by 3,4% in 2011/2012 and overestimated the crop in 2009/2010 by 0,48%. The five
year average “underestimated” figure aims at 8,2% and the “overestimated” figure aims at 3,9%. During the past ten years, the crop was 6/10 years underestimated and
4/10 years overestimated.
** Grain SA’s projections provide for early deliveries of 489 000 ton. It is equal to the latest five years (2009/2010 - 2013/2014) average early delivery figure for March and
April. During the five year period the smallest number of early deliveries aimed at 171 102 tons and the largest number of early deliveries equals 841 586 tons. Conse-
quently, the average delivery figure of 489 000 tons needs to be increased by 317 898 tons when early deliveries are limited to 171 102 ton. The adjustment is necessary
as the need for imports increase. Following the same argument it is needed to decrease the early delivery figure of 489 000 tons by 352 586 tons if the number of early
deliveries reach 841 586 tons.
ON FARM LEVEL
GRAIN MARKET-OVERVIEW
SA Grain/
Sasol Chemicals (Fertiliser) photo competition


