


 54 / 132

September 2018
52
Increase wheat yield
with these fungicides
F
ungal diseases infecting aerial plant parts of wheat are widely
found in South Africa. Leaf diseases which frequently occur
on bread wheat include leaf rust, stem rust, stripe rust,
powdery mildew,
Septoria tritici blotch
(leaf blotch) and
Stagonospora nodorum blotch
(glume blotch). Under favourable
weather conditions, any of these diseases can cause significant yield
loss on susceptible cultivars.
Although resistant cultivars provide effective disease control, they
are prone to infections by frequently emerging new strains of these
diseases, emphasising the need for additional measures which
could contribute to sustainable control of important wheat diseases.
Amongst available options, chemical fungicides can be considered
in integrated control of wheat diseases. Hence, field studies were
conducted to determine the profitability of fungicide applications
Focus
Integrated pest control
Dr Tarekegn Terefe
and
Petrus Delport,
ARC-Small Grain, Bethlehem
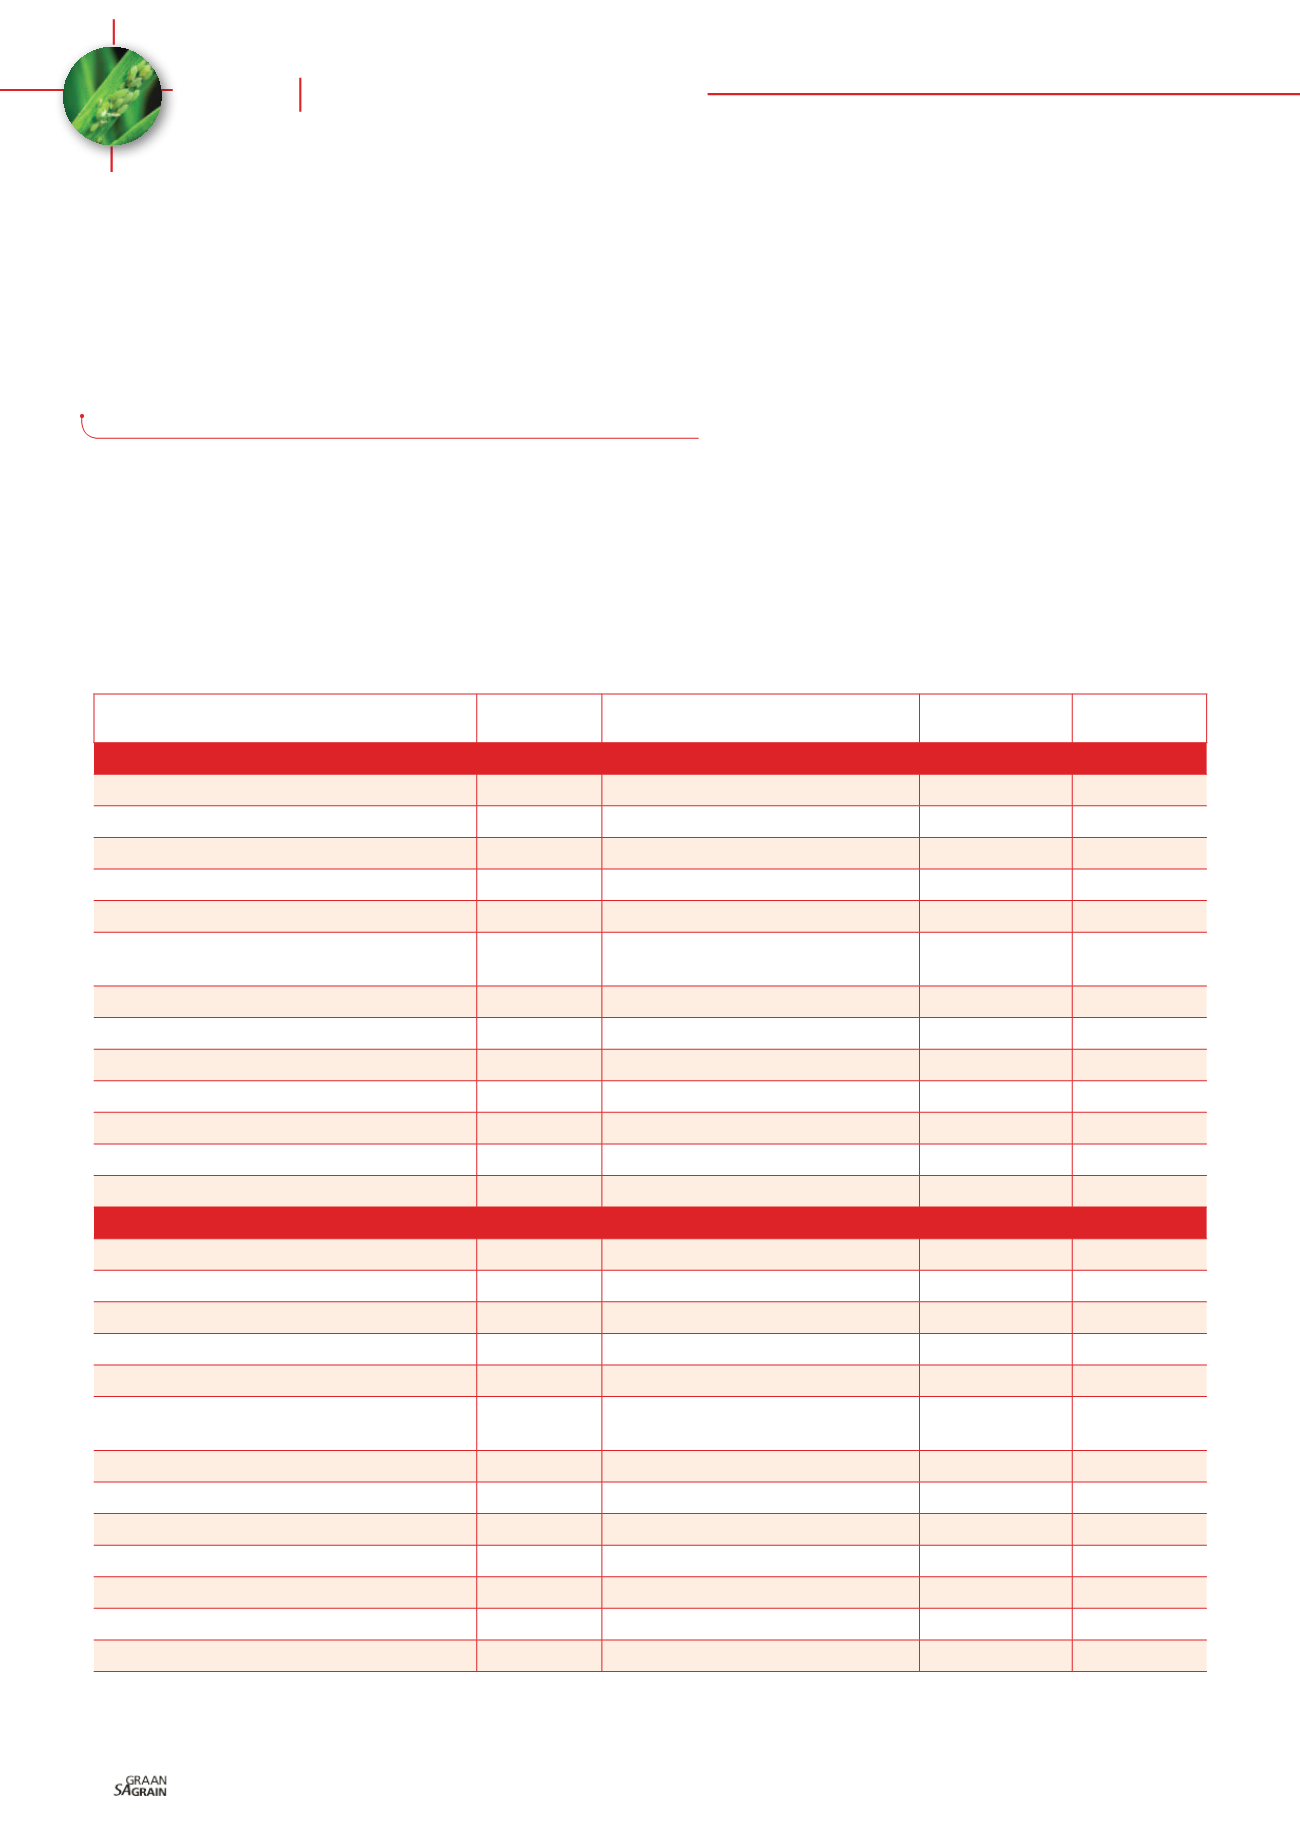
TREATMENT*
YIELD
(T/HA)
YIELD INCREASE OVER UNTREATED
CONTROL (T/HA)
GROSS BENEFIT
(R/HA) #
NET BENEFIT
(R/HA)
CULTIVAR SST 88
Epoxiconazole + Pyraclostrobin
4,132
0,571
2 116
1 266
Pyraclostrobin
4,008
0,447
1 656
806
Tebuconazole
3,991
0,430
1 595
745
Picoxystrobin + Flusilazole
3,990
0,430
1 592
742
Pyraclostrobin/Tebuconazole
3,920
0,360
1 332
482
Tebuconazole + Triadimenol + Spiroxamine/
Tebuconazole + Prothioconazole
3,876
0,316
1 169
319
Epoxiconazole
3,827
0,266
986
136
Picoxystrobin
3,823
0,262
971
121
Flusilazole
3,786
0,225
833
-17
Trifloxystrobin
3,729
0,168
623
-227
Trifloxystrobin/Epoxiconazole
3,688
0,127
471
-379
Control
3,561
-
-
-
Mean of all fungicides
3,888
0,327
1 212
362
CULTIVAR SST 056
Epoxiconazole + Pyraclostrobin
4,125
0,285
1 057
207
Pyraclostrobin
4,105
0,265
983
133
Pyraclostrobin/Tebuconazole
4,077
0,237
876
26
Trifloxystrobin
4,048
0,208
769
-81
Picoxystrobin
4,033
0,193
716
-134
Tebuconazole + Triadimenol + Spiroxamine/
Tebuconazole + Prothioconazole
3,995
0,155
575
-275
Trifloxystrobin/Epoxiconazole
3,955
0,115
425
-425
Tebuconazole
3,950
0,110
409
-441
Epoxiconazole
3,943
0,103
381
-469
Picoxystrobin + Flusilazole
3,940
0,100
370
-480
Flusilazole
3,851
0,011
40
-810
Control
3,840
-
-
-
Mean of all fungicides
4,002
0,162
600
-250
TABLE 1: COST-BENEFIT ANALYSIS OF DIFFERENT FUNGICIDE TREATMENTS ON TWO WHEAT CULTIVARS. DATA AVERAGE OF FOUR
EXPERIMENTS CONDUCTED OVER FOUR SEASONS (2014 - 2017) AND TWO LOCALITIES (MALMESBURY AND ROODEBLOEM).
* Each treatment was applied twice, i.e., at seven leaf and flag leaf stages; where products are separated by ‘/’, e.g., Pyraclostrobin/Tebuconazole, it means that
Pyraclostrobin was applied at seven leaf stage followed by Tebuconazole at flag leaf stage
# Gross benefit was calculated by multiplying the yield difference between fungicide treatment and the untreated control by wheat price per ton (based on price of
R3 705/ton during March 2018). Net benefits were calculated by subtracting double fungicide application costs of about R850 (2017 cost) from the gross benefits