


 53 / 132

This research was made possible by funding from the
Winter Cereal Trust and the ARC.
For the best overall picture, the four year
mean for moth numbers and temperatures
was calculated for each trap site. Viljoens
kroon data will be used as an example.
Viljoenskroon
Five moth peaks are present throughout
the year (
Graph 1
on page 49). A moth life
cycle was predicted to start and end with a
moth flight peak. According to the calcula
tions of accumulated day degrees from the
beginning of the year, the first life cycle was
completed within 48 days, which coincides
perfectly with the cycle on the graph.
The second life cycle was calculated to be
89 days, which also coincides with the sec
ond cycle on the graph. The temperature
threshold and thermal constant data that
were generated in Japan thus seem similar
to that in South Africa and can give a good
indication of what probably happens under
South African conditions.
Between 11 June and 20 August, the mean
daily temperature drops to below 10°C and
development will stop (Graph 1). Though
moth flight activity is found during this pe
riod, it is not clear if eggs laid during this
period will be able to survive and develop
into larvae.
Eggs laid during September (240 days -
250 days) will complete the life cycle at
310 days, which is the beginning of Novem
ber. Surveys were conducted early in Octo
ber (260 days - 280 days) and feeding signs
as well as larvae were found.
As these observations were made during
the middle of the predicted life cycle, it sug
gests that the prediction could fit. From
310 days, eggs will hatch within six days
rendering larvae ready to feed on the ripen
ing barley and wheat crop (Graph 1).
Help predict outbreaks
This model provides better insight into what
happened during 2010. We have developed
a spreadsheet model, which is easy to use,
but this should be validated under field con
ditions first, before producers can use it.
Producers will soon be able to use their own
trap and temperature data logger to deter
mine a possible outbreak situation.
When high moth numbers occur, specifi
cally during September, the probability is
strong that high numbers could be present
at the end of the barley-growing season.
However, sudden cold fronts could delay
the development of the insect and prevent
an outbreak during the critical time. Valida
tion will be performed during the next three
years, after which it will be made available
to the producers.
For any enquiries contact the
author at
prinsloogj@arc.
agric.za
.
Reference
Hirai, K. 1975.
The influence of rearing temperature
and density on the development of two
Leucania
spe-
cies,
L. loreyi Dup. and L. separata. Walker (
Lepidop-
tera: Noctuidae
).
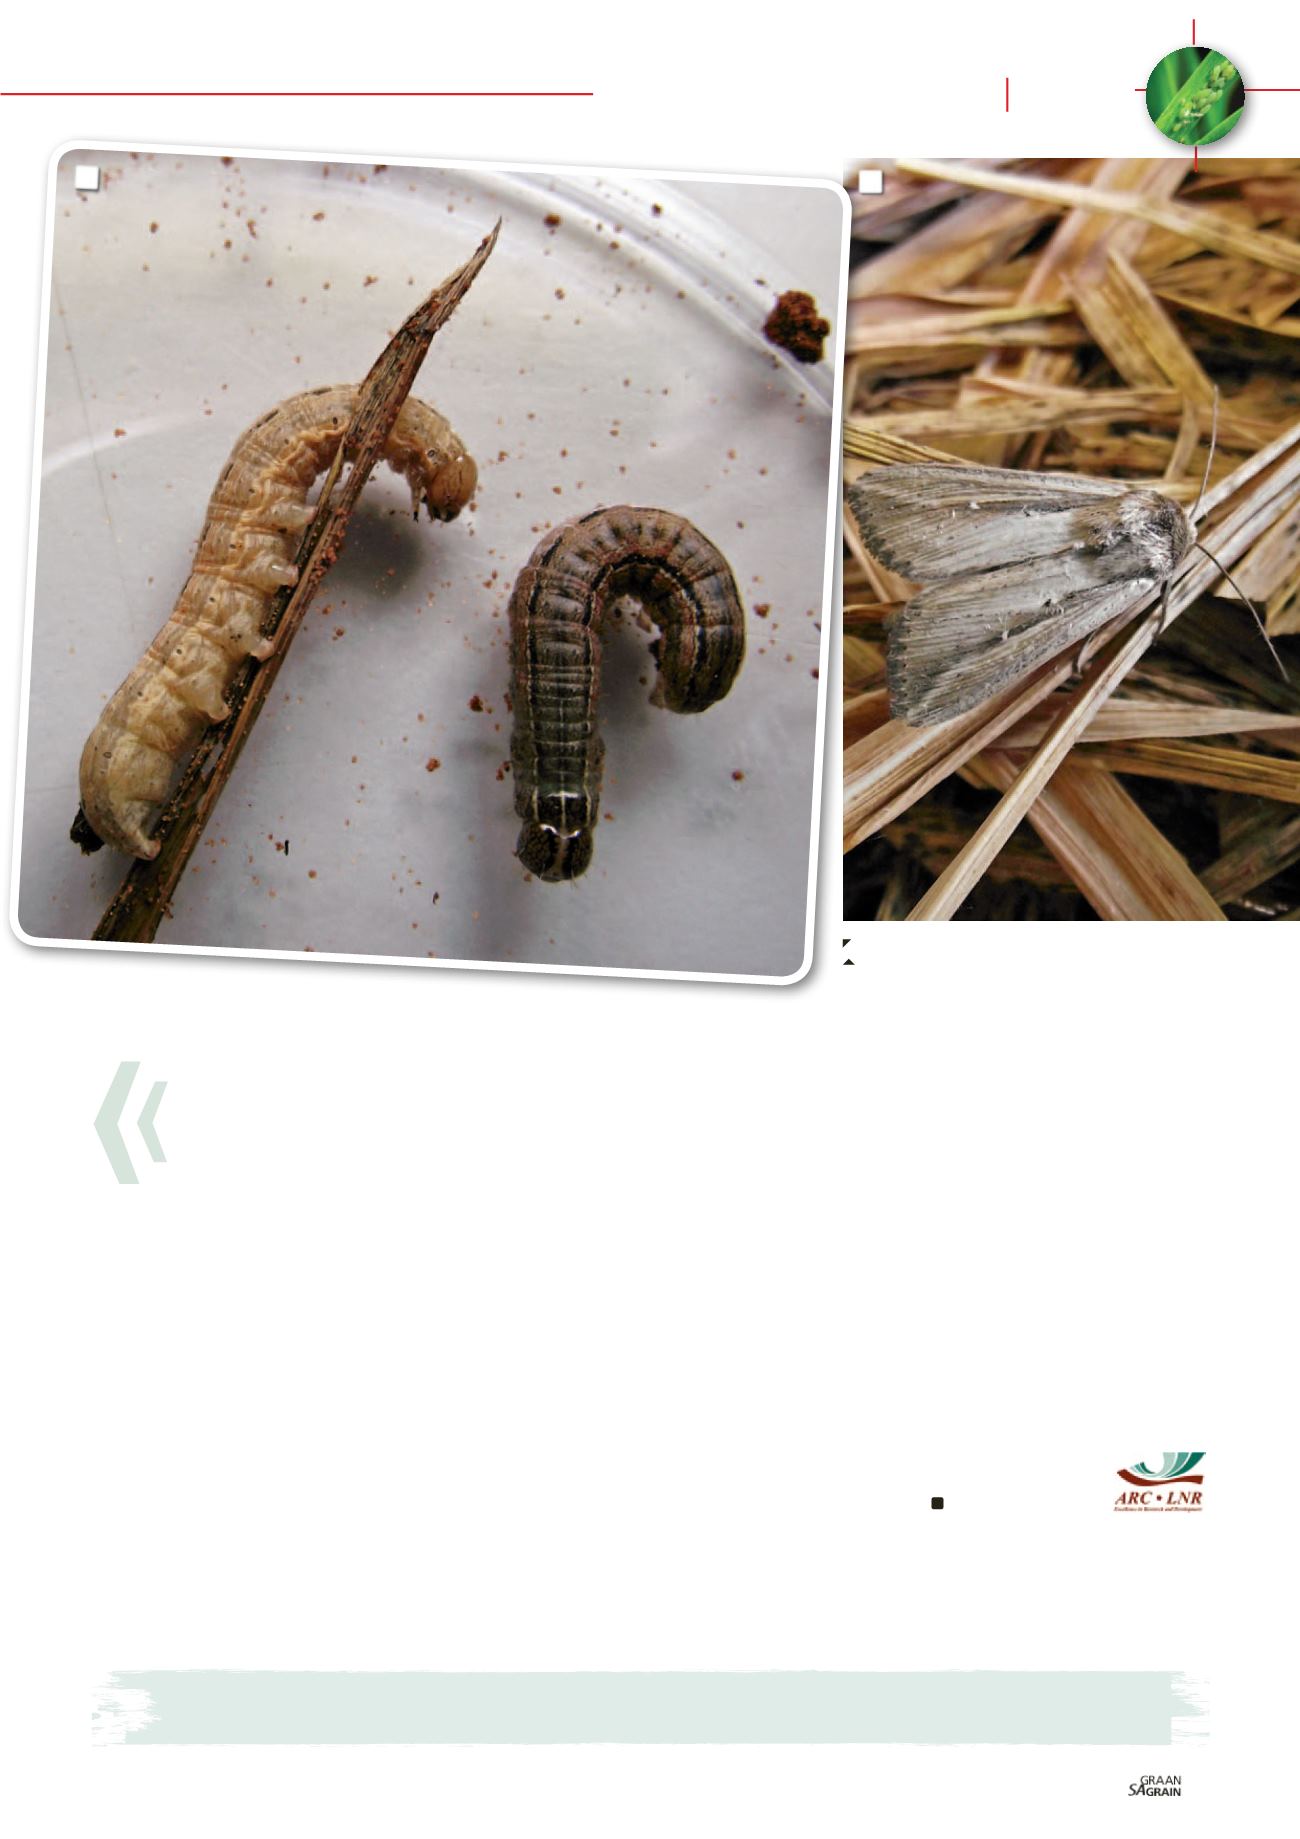
1: The false armyworm larva.
2: A false armyworm adult moth.
2
1
FoCus
Integrated pest control
Staying one step ahead
51
September 2018